
Find research datasets worth reusing
Search datasets from major research repositories and use ShareScore to quickly assess how well each record supports discovery, access, and reuse.
710
datasets available to search
ShareScore release 0.7.1
Dataset results
710 results for “NASA”
Planetary body limb and plume labels for NASA images
<p>This data set was compiled to aid in evaluating methods for automated analysis of images to detect planetary bodies and limbs. It contains manually generated labels for 308 NASA images of planets and moons. The labels annotate the location of the limb (edge) of the body and plumes emitted by the body, if any. "Plume" in this context refers to any bright material emitted from the body, such as icy plumes from Enceladus or volcanic plumes from Io. 112 of the labeled images contain plumes.</p> <p><strong>Contents:</strong></p> <p>This data set covers images collected by the following instruments:</p> <ol> <li>Cassini Imaging Science Subsystem (ISS)</li> <li>Galileo Solid-State Imaging (SSI)</li> <li>MESSENGER Mercury Dual Imaging System (MDIS)</li> <li>New Horizons Long Rang Reconnaissance Imager (LORRI) </li> </ol> <p>The target bodies include the planet Mercury; Jupiter's moons Callisto, Europa, Ganymede, and Io; and Saturn's moon Enceladus. </p> <p>There is a directory for each instrument_target combination:</p> <ul> <li>cassini_iss_enceladus/: Cassini ISS narrow-angle camera observations of Saturn's moon Enceladus</li> <li>galileo_ssi_callisto/: Galileo SSI observations of Jupiter's moon Callisto</li> <li>galileo_ssi_europa/: Galileo SSI observations of Jupiter's moon Europa</li> <li>galileo_ssi_ganymede/: Galileo SSI observations of Jupiter's moon Ganymede</li> <li>galileo_ssi_io/: Galileo SSI observations of Jupiter's moon Io</li> <li>messenger_mdis_mercury/: MESSENGER MDIS narrow-angle and wide-angle observations of Mercury </li> <li>new_horizons_lorri_io/: New Horizons LORRI observations of Jupiter's moon Io</li> </ul> <p>Source images: The images that are associated with each label file can be obtained from the Planetary Data System (PDS) at <a href="https://pds-imaging.jpl.nasa.gov/search">https://pds-imaging.jpl.nasa.gov/search</a> . For Cassini ISS, MESSENGER MDIS, and New Horizons LORRI images, search on the product id from the label filename. For example, the product id for </p> <pre><code class="language-bash">lor_0035092814_0x630_sci_label.yml </code></pre> <p>is</p> <pre><code class="language-bash">lor_0035092814_0x630_sci</code></pre> <p>For Galileo SSI images, the filename does not include the product id. A list of the source product ids is included in the file named </p> <pre><code class="language-bash">galileo_image_ids.txt</code></pre> <p><strong>Label format:</strong></p> <p>Labels are stored in YAML format. The limb is annotated as a series of points marked along the limb such that a least-squares circle fit of those points provides a model of the body's limb ("points" field). Plumes, when present, are indicated as one or more angular ranges (in radians) around the limb within which plume activity is present ("plumes"->"intervals" field). Angles are specified starting with 0 radians (up) and proceeding clockwise. The user who generated the labels is recorded in the "user" field. </p> <p>Example (galileo_ssi_io/0085r_label.yml):</p> <p>Six points define the limb of the body, and there are two areas of plume activity. </p> <pre><code class="language-bash">comment: Points are in (x, y), i.e. (col, row), order. plumes: comment: Intervals in radians intervals: - [2.8540078295092326, 3.020573420947303] - [3.219430581132992, 3.352047930386058] user: mcameron points: - [123.09103311855094, 322.15933747194225] - [143.78220150957688, 79.06162214909591] - [89.23475042871942, 219.0261628709045] - [256.9650789538681, 407.0275241755675] - [176.84241267100913, 375.9514805780413] - [113.07652569773596, 121.72097703075002] user: mcameron</code></pre> <p><strong>Attribution: </strong></p> <p>If you use this data set in your own work, please cite this DOI: 10.5281/zenodo.2556063 . </p>
Climate Forced Hydropower Simulations for the African Continent Using NASA NEX GDDP
<p>This dataset includes the results of simulations of future hydropower usable capacity for power plants across the five African power pools. These include 87 power plants in 27 different countries. These simulations have been forced using NASA's Earth Exchange Global Daily Downscaled Projections (NEX-GDDP) dataset, which includes maximum temperature, minimum temperature, and precipitation simulations from 21 Global Climate Models (GCM) and three scenarios. The scenarios include a retrospective run (1950-2005) and two projection runs for Representative Concentration Pathways (RCP) 4.5 and 8.5. We include a PDF file "Description of Data.pdf" that describes all the information included in the dataset. </p> <p>This work is based on the future publication: Caceres, A.L., Jaramillo, P., Matthews, H.S., Samaras, C, & Nijssen, Bart. "Power pools for the win: Assessing climate resilience of hydropower resources in African power pools".</p>
NASA GISS-E2-1G model runs with and without irrigation
<p>This dataset includes NASA GISS ModelE2.1G model runs with irrigation at the Year 2000 (Irrig_2000), halved irrigation at the Year 2000 (Irrig_2000half), and irrigation at the Year 1850 (Irrig_1850). The climate variables included in this dataset are: daily maximum temperature, equivalent temperature, and minimum relative humidity, and monthly latent heat flux, sensible heat flux, specific humidity, precipitation, incident solar radiation, and total cloud cover.</p>
NASA's Airborne Topographic Mapper (ATM) airborne waveform and ground calibration data for the Arctic Spring campaign 2016
<p>The Airborne Topographic Mapper (ATM) was a scanning lidar developed and used by NASA for observing the Earth’s topography for several scientific applications, foremost of which was the measurement of changing Arctic and Antarctic ice sheets, glaciers and sea ice. ATM measured topography to an accuracy of better than 5 centimeters by incorporating measurements from GPS (global positioning system) receivers and inertial navigation system (INS) attitude sensors.</p> <p>In pressurized aircraft the transmitted laser pulse travels thru the aircraft’s optical window close to the scan mirror. The optical delay fiber that is necessary to separate the transmit pulse and window reflection as well as other system components introduce a laser time-of-flight range bias that needs to be determined from ground calibration measurements. This data set includes ATM airborne waveform data from the T2 lidar, as well as the ground test data and true ranges for the Arctic Spring campaign 2016.</p> <p>A collection of MATLAB® functions to read ground test waveform and airborne waveform data is available at: <a href="https://doi.org/10.5281/zenodo.6341229">https://doi.org/10.5281/zenodo.6341229</a></p> <p><strong><strong>See also:</strong> </strong></p> <ul> <li>NASA's Airborne Topographic Mapper (ATM) ground calibration data for waveform data products: <a href="https://doi.org/10.5281/zenodo.7225936">https://doi.org/10.5281/zenodo.7225936</a></li> <li>User guide for NASA's Airborne Topographic Mapper HDF5 waveform data products:<a href="https://doi.org/10.5281/zenodo.7246097"> https://doi.org/10.5281/zenodo.7246097</a></li> <li>Collection of MATLAB® functions for working with ATM (Airborne Topographic Mapper, laser altimetry data products in HDF5 waveform format: <a href="https://github.com/mstudinger/ATM-waveform-tools">https://github.com/mstudinger/ATM-waveform-tools</a></li> <li>Airborne Topographic Mapper (ATM) Bathymetry Toolkit (MATLAB® functions): <a href="https://doi.org/10.5281/zenodo.6341229">https://doi.org/10.5281/zenodo.6341229</a></li> <li>All ATM data products are freely available at the National Snow and Ice Data Center (NSIDC) at <a href="https://nsidc.org/data/icebridge">https://nsidc.org/data/icebridge</a> and can also be downloaded from the NASA Earthdata portal at <a href="https://earthdata.nasa.gov/">https://earthdata.nasa.gov/</a></li> <li>The ILATMW1B airborne waveform data is available at NSIDC: <a href="https://nsidc.org/data/ILNSAW1B/versions/1">https://nsidc.org/data/ILNSAW1B/versions/1</a> (narrow swath) <a href="https://nsidc.org/data/ILATMW1B/versions/1">https://nsidc.org/data/ILATMW1B/versions/1</a> (wide swath)</li> </ul>
A Universe of Sound: Processing NASA Data into Sonifications to Explore Participant Response
<p>Files containing additional data for the first and second open-ended response questions of the survey discussed in Section 3.3 of the paper "A Universe of Sound: Processing NASA Data into Sonifications to Explore Participant Response" and text descriptions of the associated sonifications of three astronomical objects (the Galactic Center, Cassiopeia A, and the Chandra Deep Field South).</p>
POLAR-Sim: Augmenting NASA's POLAR dataset for data-driven lunar perception and rover simulation
Open the record for dataset details and reuse information.
Bioclimatic predictors in Maricopa County, Arizona derived from remotely sensed, daily weather parameters (NASA DAYMET): 2000-2016
overview There is considerable interest in using climatic variables and bioclimatic predictors not only in ecological species distribution models but in interdisciplinary studies of urban environments. We compiled an downloadable geodatabase of monthly environmental variables on a 1km x 1km spatial resolution including raw climate variables such as precipitation, minimum and maximum air temperature, and water vapor pressure obtained from NASA Earth Science Data and Information System Daily Surface Weather and Climatological Summaries (DAYMET) for Maricopa County. We then used the continuous environmental data from DAYMET to create 19 different annual bioclimatic predictors for Maricopa County (as defined by Nix, 1986 and Hijmans, 2004). Our study is the first to utilize NASA DAYMET model data to generate bioclimatic predictors. Bioclimatic predictors are important variables to use in model development to study nuances of seasonality especially when compiling models of species and vegetation. This geodatabase of environmental variables provides accessible vital data for the entire Central Arizona–Phoenix Long-Term Ecological Research (CAP LTER) study area that can be used in an array of interdisciplinary studies. related data set Processed DAYMET data from which the data in this data set were derived are accessible from: https://portal.edirepository.org/nis/mapbrowse?scope=knb-lter-cap&identifier=662 literature cited Hijmans, R.J., Cameron, S.E., Parra, J.L., Jones, P.G. and Jarvis, A., 2004. The WorldClim interpolated global terrestrial climate surfaces. Version 1.3. Nix, Henry A., 1986, A biogeographic analysis of Australian elapid snakes, in Longmore, Richard, ed., Atlas of elapid snakes of Australia: Canberra, Australian Flora and Fauna Series 7, Australian Government Publishing Service, p. 4‒15.
Subaerial beach topography at NASA-Kennedy Space Center, Florida, U.S.A between 2009 and 2014
<p>This dataset provides approximately monthly observations of beach topography for nearly five-years along the subaerial beach fronting NASA-Kennedy Space Center, Florida. Full details of data collection and processing can be found in the PhD dissertation of the lead author (<a href="https://search.proquest.com/docview/1508271661/abstract/70EE269DD557426CPQ/1">https://search.proquest.com/docview/1508271661/abstract/70EE269DD557426CPQ/1</a>). Two reports discussing these data are also provided in pdf format. The dataset includes data collected via ATV-mounted real time kinematic (RTK) GPS (all files beginning with "DEM_'") as well as data collected via backpack-mounted RTK GPS (all files beginning with "CpCnv_") concurrently with some ATV surveys. Data from each ATV survey is provided as a Matlab .mat file and include pre-processed X, Y, and Z location/elevation data referenced to UTM Zone 17 and NAVD88 vertical datum. Each file also includes gridded point coordinates at 1m x 1m resolution for northern (g_n) and southern (g_s) sections of the site and cross-shore transects created from these (T). Data from each backpack survey are also provided as Matlab .mat files, and contain cross-shore transects (T) referenced to UTM Zone 17 and NAVD88 vertical datum.</p>
参考 Bogda Mountains China earth as art(NASA)画像貼付版
**参考 Bogda Mountains China 「2018 earth as art」(NASA)画像貼付版** 垂直倍率:×10.0 [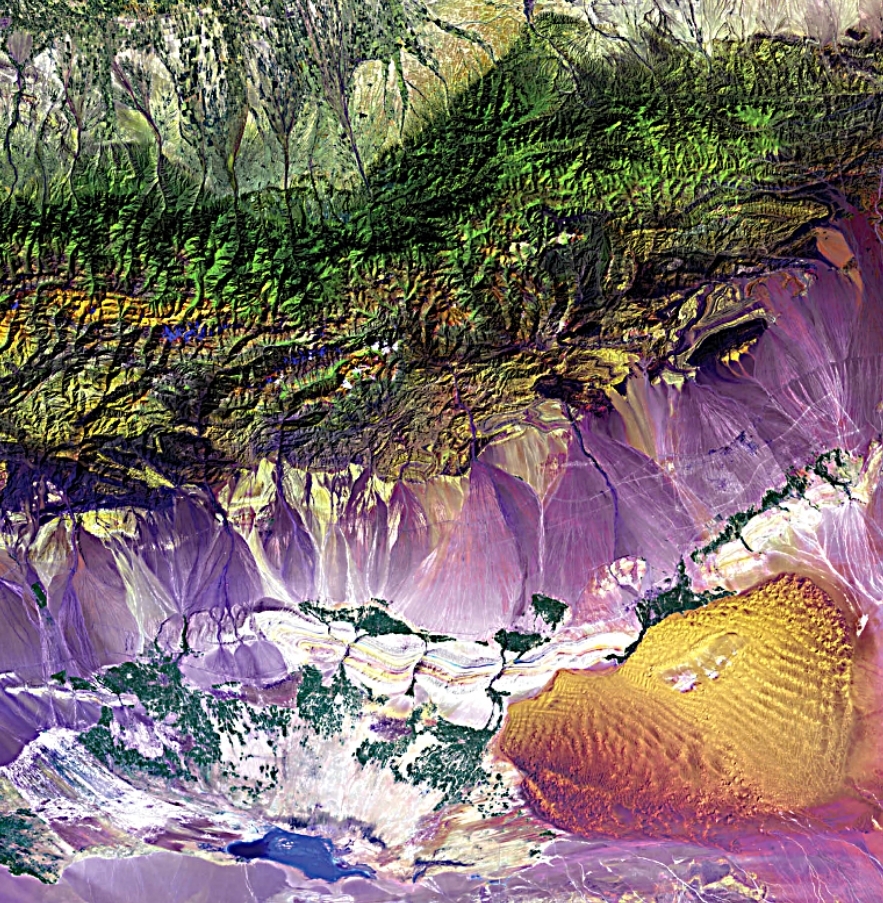](https://gyazo.com/ae17bbe7d67fd6494ba228ace2901576) 「2018 earth as art」(NASA)画像貼付 出典: Generator: DEM Net Elevation API - https://elevationapi.com Digital Elevation Model: ETOPO1 - NOAA - https://www.ngdc.noaa.gov/mgg/global/ Imagery: Esri World Imagery - https://services.arcgisonline.com/ArcGIS/rest/services/World_Imagery/MapServer 3DF Zephyr v5.019でアップロート Source: Objaverse 1.0 / Sketchfab
Fire-D: Analysis and ML-Ready NASA-Centric Remote Sensing of Wildfire and Smoke
<p>Earth science remote sensing imagery is rich in structural and spectral information, making such data an ideal platform for benchmarking for a broad range of machine learning (ML) tasks, from pattern retrieval to physics-informed classification to anomaly detection to transfer learning. Nevertheless, the utility of Earth science remote sensing data remains largely unexplored by the broader ML community. Our goal is to bridge this gap and bring a rich variety of multisource multi-resolution Earth image data to a wider range of ML researchers who are non-experts in remote sensing, thereby increasing the utility and societal impact of such data products. In particular, motivated by the emerging wildfire crisis, we present radiometrically and geometrically calibrated radiance data from airborne and orbital instruments from the National Aeronautics and Space Administration (NASA), the National Oceanic and Atmospheric Administration (NOAA), and the Korean Meteorological Administration (KMA).</p> <p>Given the scarce occurrence of wildfires and complex spatio-temporal dependencies in radiance data, these datasets are especially well suited for benchmarking unsupervised and self-supervised learning tasks both on images and non-Euclidean objects. Our experiments on these datasets indicate that contrastive learning and transfer learning algorithms can capture the structures of views and scenes, map pixel space of multi-sensor imagery to a high-level embedding space for further downstream tasks, and facilitate more cohesive integration of the state-of-the-art ML approaches into wildfire risk analytics.</p> <p>All NASA-based observations are freely usable under the <a href="https://science.data.nasa.gov/license/">Creative Commons Zero License</a>.There are also no restrictions on the use of <a href="https://registry.opendata.aws/noaa-goes/">GOES Data</a>. <a href="https://registry.opendata.aws/noaa-gk2a-pds/">GK2A data</a> are also open data without any restrictions on its use.<br><br>For the Planet data, we cannot not share the Radiances, but all masks within this dataset are freely usable with no restrictions.</p> <p> </p> <p>Use:</p> <p>On the data input, input geometrically and radiometrically calibrated radiance data has been pulled from various NASA, NOAA, Planet, and KMA archives. For instruments that have multiple different spatial resolutions within their spectral bands (GOES and GK2A), all bands have been resampled to the lowest collective spatial resolution.</p> <p>Geometric and radiometric calibration has been done by the science data processing pipelines of the various missions, and would not need to be done by anyone else looking to curate the same data. Further information for each instrument can be found in each of the publicly available Level-1 algorithm theoretical basis documents (ATBDs)</p> <p>All input and label data have been put in GeoTiff format. Each band is in a separate raster band and each scene is in a separate GeoTiff file. Label files and input files are in separate tar files, labeled respectively, and the file names match for input and labels, with the exception of an additional .fire and .smoke in the respective label filenames and subfolders.<br><br>The <a href="https://www.earthdata.nasa.gov/about/esdis/esco/standards-practices/geotiff">GeoTiff</a> data format natively contains geolocation metadata internally, and can be interfaced with via C/C++/Python <a href="https://gdal.org/en/stable">GDAL</a> packages, or other python packages that wrap GDAL, like <a href="https://rasterio.readthedocs.io/en/stable/">rasterio</a> and <a href="https://corteva.github.io/rioxarray/stable/">rioxarray</a> . The documentation for <a href="https://nicks-personal-organization-2.gitbook.io/sit-fuse">SIT-FUSE</a> , the package with which the labels were generated, also has examples on how to read and interface with various data formats, including GeoTiffs. Lastly, this data can be interfaced with using Geographic Information Systems (GIS), like the free and open-source <a href="https://qgis.org/">QGIS</a>.</p> <p>An example of programmatic data access and usage can be found in the dataset's associated <a href="https://github.com/Fire-D-Dataset/FIRE-D">GitHub repository</a>. </p> <p>A working example using data from this repository for ML tasks is available <a href="https://drive.google.com/drive/folders/16aJO6LhrxJ3gsWoTU9BNN3hsb8W0refG?usp=sharing">here</a>.</p> <p>Timing information can be found in the file names, which all use the standard formats from the various instruments' L1B datasets.</p> <p>V2 includes additional GOES-18 radiance data and associated smoke and fire labels for the recent LA fires (Palisades and Eaton fires in January of 2025).</p> <p>V3 provides a reorganization of all data, and an inclusion of improved and additional data from airborne and satellite platforms in 2019, associated with this study: https://arxiv.org/pdf/2501.15343 . </p> <p>V4 provides additional AVIRIS-C Radiances and fixes the spatial range of the GOES-17 radiances to match that of the associated labels. The AVIRIS-C radiances are split across 5 tar files, ordered temporally - all associated labels are in a single tar file.</p> <p><br>Current fire coverage includes:</p> <ul> <li>2019: Williams Flats, Sheridan, Horsefly, and Mosquito (US)</li> <li>2022: Uljin Forest Fire (S. Korea; largest fire on record in S. Korea)</li> <li>2025: Palisades and Eaton Fires (US)</li> </ul> <p>Additional data for the 2025 Palisades and Eaton fires from the TEMPO instrument is currently being validated and will be released in a V4 shortly.</p> <p>Croissant file for dataset metadata specification is also included</p> <p>Validation:</p> <p>These labels have been extensively validated and further information can be referenced in associated publications:<br><a href="https://doi.org/10.3390/rs13122364">https://doi.org/10.3390/rs13122364</a><br><a href="https://doi.org/10.3390/rs17071267">https://doi.org/10.3390/rs17071267</a></p> <p> </p> <p> </p>
Seasonal Variation of Thermospheric Composition Observed by NASA GOLD
We examine characteristics of the seasonal variation of thermospheric composition using column number density ratio ∑O/N2 observed by the NASA Global Observations of Limb and Disk (GOLD) mission from low-mid to mid-high latitudes. We found that the ∑O/N2 seasonal variation is hemispherically asymmetric: in the southern hemisphere, it exhibits the well-known annual and seminal pattern, with highs near the equinoxes, and primary and secondary lows near the solstices. In the northern hemisphere, it is dominated by an annual variation, with a minor semiannual component with the highs shifting towards the wintertime. We also found that the durations of the December and June solstice seasons in terms of thermospheric composition are highly variable with longitude. Our hypothesis is that ion-neutral collisional heating in the equatorial ionization anomaly region and auroral Joule heating play substantial roles in this longitudinal dependency.
NASA GSFC Firn Densification Model version 1.2.1 (GSFC-FDMv1.2.1) for the Greenland and Antarctic Ice Sheets: Jan 1980 - Jul 2024
<p><strong>Overview</strong></p> <p>The NASA GSFC-FDM v1.2.1 provides the evolution of firn air content (FAC), surface mass balance (SMB) (and its individual components), and total firn height change over the Greenland and Antarctic Ice Sheets from January 1, 1980 to July 30, 2024 at 5-day temporal resolution. The model uses atmospheric forcing from NASA GMAO's Modern-Era Retrospective Analysis for Research and Applications, Version 2 (MERRA-2) global atmospheric reanalysis, combined with a higher resolution replay (see Medley et al., 2022) as input into the Community Firn Model (CFMv1.1.6) to simulate the evolution of firn properties across the ice sheets. The GSFC-FDMv1.2.1 is provided on a 12.5 km x 12.5 km North/South Polar Stereographic Grid, depending on the ice sheet.</p> <p>For a thorough description of how the GSFC-FDMv1.2.1 was generated see Medley et al. (2022) in <em>The Cryosphere</em>. Release 2 contains model output up through June 30, 2022, whereas the initial release only extended through September 30, 2021. Release 3 contains model output up through July 31, 2024 and uses CFMv2.3.1. The model set up is identical between releases.</p> <h3>*** The spatial grids are incorrect in this version, so we have restricted access to these files. Please use Version 4. ***</h3>
NASA 3D images catalog
<p>El archivo CSV nasa_3d_models.csv contiene información detallada sobre modelos 3D recopilada del sitio web de la NASA. Los campos incluyen:</p><p>Titles: Título del modelo 3D.</p><p>Descriptions: Descripción del modelo 3D.</p><p>Imagen3D Links: URL de la imagen 3D del modelo.</p><p>Authors: Autores u origen del modelo.</p><p>Missions: Misión relevante del modelo.</p><p>Dates: Fecha de agregado del modelo.</p><p>Keywords: Palabras clave asociadas al modelo.</p><p>Repositories: Enlace al repositorio de GitHub del modelo.</p><p>zips: URL del archivo ZIP asociado al modelo.</p>
Satelite Suan Nasa
Encaminando nuestra proyeccion de satelites de suan con ayuda de la Nasa Source: Objaverse 1.0 / Sketchfab
NASA_ACCDAM_FLEXPART_ERA5_BackTrajectory_28yrOzone_WNA
<p>We are planning to publish our model product on source-receptor relationship (SRR) simulations using FLEXPART-ERA5 in backward mode. This dataset spans 28 years (1994–2021) of ozone observations, covering altitudes from 900 hPa to 300 hPa over western North America.</p> <p>The resulting SRR allows users to investigate the similarities and differences in the origin locations of air parcels that contained, for instance, the highest and lowest ozone levels when sampled near or over western North America.</p> <p>We have uploaded an example of our product on this site, and the complete dataset will ultimately be archived at NASA's Atmospheric Science Data Center (ASDC). Specifically, this sample include: 1) a folder for one-month SRR with a corresponding readme file ("<a href="https://zenodo.org/api/records/14227019/draft/files/WUSA_201607_v2.zip/content" target="_blank" rel="noopener noreferrer">WUSA_201607_v2.zip</a>")<span>. 2) a monthly averaged NetCDF file with an accompanying readme file ("</span><a href="https://zenodo.org/api/records/14227019/draft/files/Example_montly_2001-02_NH.nc/content" target="_blank" rel="noopener noreferrer">Example_montly_2001-02_NH.nc</a><span>"). 3) three MATLAB scripts for binary-to-NetCDF conversion (connecting 1) and 2)). 4) the 28-year ozone data CSV file ("<a href="https://zenodo.org/api/records/14227019/draft/files/Receptor_western_NAmerica_ozone_obs_1994_2021_from900to300.csv/content" target="_blank" rel="noopener noreferrer">Receptor_western_NAmerica_ozone_obs_1994_2021_from900to300.csv</a>"). </span></p> <p>Additionally, we have prepared a to-be-submitted manuscript to describe this product in detail, including its associated applications.</p> <p> </p>
WindSightNet: Catalogue of wind speed and direction data from NASA InSight lander on Mars using seismic data
<p>Dataset associated with the publication "WindSightNet: the inter-annual variability of Martian winds retrieved from InSight's seismic data with machine learning" submitted to JGR: Planets.</p> <p>Authors:</p> <p>A. E. Stott, R. F. Garcia, N. Murdoch, D. Mimoun, M. Drilleau, C. Newman, A. Spiga, D. Banfield, M. Lemmon, S. Navarro, L. Mora-Sotomayor, C. Charalambous, W. T. Pike, P. Lognonné, W. B .Banerdt</p> <p>Files containing catalogue of winds produced from the seismic data on the NASA InSight mission using machine learning algorithm produced in above publication. Please refer to this publication for technical details.</p> <p> </p> <p>Contents:</p> <p>WindSightNet.csv - file containing wind speed and direction produced from the WindSightNet neural network based on seismic data</p> <p>TWINS.csv - comparitive wind speed and direction from TWINS wind sensor when available. </p> <p>TWINS data originally available from:</p> <p>J A Manfredi, Insight Auxiliary Payload Sensor Subsystem (APSS) Temperatures and Wind Sensor for Insight (TWINS) Archive Bundle, (2019), https://doi.org/10.17189/1518950</p> <p> </p> <p>Each file contains values for:</p> <p>Wind Speed</p> <p>Wind dir.</p> <p>Sol - number of sol of InSight mission </p> <p>UTC - Coordinated Universal Time of sample</p> <p>LTST - Local True Solar Time of sample</p> <p>L_s - Solar longitude value of sample</p> <p>Time - seconds since UNIX epoch</p> <p>Data is considered to be sampled at a rate of 0.01 Hz when there are no gaps.</p> <p> </p> <p>Example code for plotting paper figures can be found:</p> <p>https://doi.org/10.5281/zenodo.14267939</p>
Aircraft profiles of stable isotope ratios in atmospheric total and condensed water from the NASA ORACLES mission.
<p>Aircraft in-situ measurements of water concentration and heavy water isotope ratios D/H and 18O/16O of cloud water and total water (water vapor plus condensed water) were collected during the NASA ObseRvations of Aerosols above CLouds and their intEractionS (ORACLES) project. Aircraft sampling took place in the southeast Atlantic marine boundary layer and lower troposphere (equator to 22 degrees south) over the months of Sept. 2016, Aug. 2017, and Oct. 2018. Isotope measurements were made using cavity ring-down spectroscopic analyzers integrated into the Water Isotope System for Precipitation and Entrainment Research (WISPER). The WISPER data are processed into mean latitude-altitude curtains and individual vertical profiles for each sampling period.</p> <p> </p> <p>The WISPER data accompanied a suite of other variables including standard meteorological quantities (wind, temperature, moisture), trace gas and aerosol concentrations, radar, and lidar remote sensing, which can be accessed through the DOIs listed further down. The ORACLES campaigns are described by Redemann et al., (2021). The water isotope measurements are further described in Henze et al., (2021). The absolute error with respect to the SMOW-SLAP scale is explained in detail by Henze et al., (2021).</p> <p> </p> <p>Total water concentration and isotope ratios were binned and averaged onto latitude-altitude grids using a kernel estimation approach, with weighting designed to estimate the mean during the approximate month-long duration of each sampling period. Standard deviations for each bin are also computed using kernel density estimation.</p> <p> </p> <p>Time intervals during aircraft vertical profiling are isolated and averaged onto 50-meter vertical levels. The files include water concentration and isotope ratios for both total water and cloud water in addition to temperature, pressure, latitude, and longitude.</p> <p> </p> <p>See included file README.txt for additional details.</p> <p> </p> <p>References</p> <p>---------------</p> <p>Henze, D., Noone, D., and Toohey, D.: Aircraft measurements of water vapor heavy isotope ratios in the marine boundary layer and lower troposphere during ORACLES, Earth Syst. Sci. Data Discuss. [preprint], https://doi.org/10.5194/essd-2021-238, in review, 2021.</p> <p> </p> <p>Redemann, J., Wood, R., Zuidema, P., Doherty, S. J., Luna, B., LeBlanc, S. E., Diamond, M. S., Shinozuka, Y., Chang, I. Y., Ueyama, R., Pfister, L., Ryoo, J.-M., Dobracki, A. N., da Silva, A. M., Longo, K. M., Kacenelenbogen, M. S., Flynn, C. J., Pistone, K., Knox, N. M., Piketh, S. J., Haywood, J. M., Formenti, P., Mallet, M., Stier, P., Ackerman, A. S., Bauer, S. E., Fridlind, A. M., Carmichael, G. R., Saide, P. E., Ferrada, G. A., Howell, S. G., Freitag, S., Cairns, B., Holben, B. N., Knobelspiesse, K. D., Tanelli, S., L'Ecuyer, T. S., Dzambo, A. M., Sy, O. O., McFarquhar, G. M., Poellot, M. R., Gupta, S., O'Brien, J. R., Nenes, A., Kacarab, M., Wong, J. P. S., Small-Griswold, J. D., Thornhill, K. L., Noone, D., Podolske, J. R., Schmidt, K. S., Pilewskie, P., Chen, H., Cochrane, S. P., Sedlacek, A. J., Lang, T. J., Stith, E., Segal-Rozenhaimer, M., Ferrare, R. A., Burton, S. P., Hostetler, C. A., Diner, D. J., Seidel, F. C., Platnick, S. E., Myers, J. S., Meyer, K. G., Spangenberg, D. A., Maring, H., and Gao, L.: An overview of the ORACLES (ObseRvations of Aerosols above CLouds and their intEractionS) project: aerosol–cloud–radiation interactions in the southeast Atlantic basin, Atmos. Chem. Phys., 21, 1507–1563, https://doi.org/10.5194/acp-21-1507-2021, 2021.</p> <p> </p> <p>The complete archive of ORACLES data are accessible via the digital object identifiers (DOIs) provided under ORACLES Science Team references as follows:</p> <p> </p> <p>ORACLES Science Team: Suite of Aerosol, Cloud, and Related Data Acquired Aboard P3 During ORACLES 2018, Version 3, NASA Ames Earth Science Project Office, https://doi.org/10.5067/Suborbital/ORACLES/P3/2018_V3, 2020a. </p> <p> </p> <p>ORACLES Science Team: Suite of Aerosol, Cloud, and Related Data Acquired Aboard P3 During ORACLES 2017, Version 3, NASA Ames Earth Science Project Office, https://doi.org/10.5067/Suborbital/ORACLES/P3/2017_V3, 2020b. </p> <p> </p> <p>ORACLES Science Team: Suite of Aerosol, Cloud, and Related Data Acquired Aboard P3 During ORACLES 2016, Version 3, NASA Ames Earth Science Project Office, https://doi.org/10.5067/Suborbital/ORACLES/P3/2016_V3, 2020c. </p> <p> </p> <p>ORACLES Science Team: Suite of Aerosol, Cloud, and Related Data Acquired Aboard ER2 During ORACLES 2016, Version 3, NASA Ames Earth Science Project Office, https://doi.org/10.5067/Suborbital/ORACLES/ER2/2016_V3, 2020d.</p>
Assimilation of NASA's Airborne Snow Observatory snow measurements for improved hydrological modeling: A case study enabled by the coupled LIS/WRF-Hydro system
<p>Data Analysis Scripts and Post-Processed Model Data for a case study using assimilation of ASO Snow Data into the NASA LIS/WRF-Hydro Model. </p> <p>Manuscript Citation:</p> <p>Lahmers T. M., S. V. Kumar, D. Rosen, A. L Dugger, D. Gochis, J. A. Santanello, C. Gangodagamage<sup>,</sup> and R. Dunlap,<strong> </strong>2020: Assimilation of NASA’s Airborne Snow Observatory snow measurements for improved hydrological modeling: A case study enabled by the coupled LIS/WRF-Hydro system,<em>Water Resour. Res.,</em></p>
NASA TOPS FAIR Pinwheel
<p>NASA Pinwheel based on the FAIR (findable, accessible, inclusive, and reproducible)</p>
NASA SPoRT Basin Average Training Data
<p>The included data files contain basin average SPoRT-LIS relative soil moisture [Total column (0-2 m depth) and four model layers (0-10, 10-40, 40-100, and 100-200 cm depth)] and MRMS QPE for each river basin. These files were used to train and tune the developed basin specific LSTM models. The number in the file name indicates the corresponding USGS site number. </p>
ScienceDex guides
Understand access before you commit
These curated guides explain access requirements, typical timelines, costs, and reuse considerations for widely used research datasets.
Allen Brain Atlas
Allen Brain Atlas is an Allen Institute collection of brain map atlases, datasets, APIs, and analysis tools covering mouse, human, and non-human primate brain resources.
Annotated Behaviour and Observability Dataset (ABODe)
ABODe is a University of Edinburgh DataShare dataset for behavior classification in group-housed mice using home-cage video, identities, bounding boxes, ground-plate positions, and annotator labels.
DANDI Archive for NWB datasets
DANDI is a BRAIN Initiative archive for publishing and sharing neurophysiology data, including electrophysiology, optophysiology, and behavioral data packaged as NWB and related standards.
International Brain Laboratory public data
The International Brain Laboratory public data releases expose standardized mouse decision-making experiments, including Neuropixels recordings, widefield calcium imaging, behavior, and session metadata accessed through the ONE API.
OpenNeuro
OpenNeuro is a free, open platform for sharing neuroimaging datasets, with public search, dataset pages, and download paths for web, S3, DataLad, and the OpenNeuro CLI.