
Find research datasets worth reusing
Search datasets from major research repositories and use ShareScore to quickly assess how well each record supports discovery, access, and reuse.
509
datasets available to search
ShareScore release 0.9.0
Dataset results
509 results for “Version 2”
Macrosystems EDDIE Module 5 version 2: Introduction to Ecological Forecasting (Instructor Materials)
Ecological forecasting is a tool that can be used for understanding and predicting changes in populations, communities, and ecosystems. Ecological forecasting is an emerging approach which provides an estimate of the future state of an ecological system with uncertainty, allowing society to prepare for changes in important ecosystem services. Ecological forecasters develop and update forecasts using the iterative forecasting cycle, in which they make a hypothesis of how an ecological system works; embed their hypothesis in a model; and use the model to make a forecast of future conditions. When observations become available, they can assess the accuracy of their forecast, which indicates if their hypothesis is supported or needs to be updated before the next forecast is generated. In this Macrosystems EDDIE (Environmental Data-Driven Inquiry & Exploration) module, students will apply the iterative forecasting cycle to develop an ecological forecast for a National Ecological Observation Network (NEON) site. Students will use NEON data to build an ecological model that predicts primary productivity. Using their calibrated model, they will learn about the different components of a forecast with uncertainty and compare productivity forecasts among NEON sites. The overarching goal of this module is for students to learn fundamental concepts about ecological forecasting and build a forecast for a NEON site. Students will work with an R Shiny interface to visualize data, build a model, generate a forecast with uncertainty, and then compare the forecast with observations. The A-B-C structure of this module makes it flexible and adaptable to a range of student levels and course structures. This EDI data package contains instructional materials necessary to teach the module. Intructional materials (instructor manual, introductory presentation for the module, and a presentation to introduce students and instructors to R Shiny) are provided in both pdf and editable formats with
Late Latin Charter Treebank 2 (LLCT2), version 1.2
<p>Version 1.2 of the Late Latin Charter Treebank 2 (LLCT2). Contains a number of minor corrections and replaces the version 1.0 published at Zenodo in 2019. Early Medieval Latin documentary texts from Italy between AD 774-897 with morphological and syntactic annotation. Latin Dependency Treebank (LDT) compatible linguistic annotation, CoNLL treebank format. Note that LLCT2 is also available open-access in the Universal Dependencies format at the <a href="https://github.com/UniversalDependencies/UD_Latin-LLCT">website</a> of the Universal Dependencies consortium. For a detailed description of the Late Latin Charter Treebanks, see the pre-print of the paper 'Late Latin Charter Treebank: contents and annotation', to be published in Corpora, 16:2 (2021), at the <a href="https://researchportal.helsinki.fi/fi/publications/late-latin-charter-treebank-contents-and-annotation">institutional repository of the University of Helsinki</a>. See also Korkiakangas, T. and Lassila, M. (2013), <a href="https://www.academia.edu/5491302/Korkiakangas_Timo_and_Lassila_Matti_Abbreviations_fragmentary_words_formulaic_language_treebanking_mediaeval_charter_material_"><em>Abbreviations, fragmentary words, formulaic language: treebanking medieval charter material</em></a>, in Mambrini, F., Passarotti, M. and Sporleder, C., <em>Proceedings of the third workshop on annotation of corpora for research in the humanities</em>, pp. 61–72, and Korkiakangas, T. and Passarotti, M. (2011), <a href="https://pdfs.semanticscholar.org/6825/a8ad70fe6e2a77540d9ff2774b8f34804fd0.pdf?_ga=2.234021022.1247020789.1580545874-419947753.1580545874"><em>Challenges in Annotating Medieval Latin Charters</em></a>, in «Journal of Language Technology and Computational Linguistics», 26, pp. 103–114.</p>
Replication Package for: Detecting Edgeworth Cycles (Version 2)
<p>This replication package contains the <strong>data </strong>and the <strong>code </strong>to generate the main results reported in <strong>"Detecting Edgeworth Cycles"</strong> by <strong>Timothy Holt, Mitsuru Igami, and Simon Scheidegger</strong>, to be published in the February 2024 issue of <em>The Journal of Law and Economics</em>. </p> <p>Additionally, this package also allows the users to<strong> apply these pre-trained models to new datasets</strong> of their choice. As an example of such a new dataset, we include the <strong>entire German dataset available at the time of our research (2014:Q4–2020:Q4)</strong>, including both manually labeled and unlabeled subsamples.</p> <p>Finally, this package includes <strong>tools to facilitate the acquisition and pre-processing of the most recent data from Germany</strong>, which is updated every day on the <em>Tankerkoenig</em> website (at the time of our preparation of this package).</p> <p><strong>[3/29/2024 update]</strong> The URL for the German antitrust authority's fuel-data website has changed to <a href="https://www.bundeskartellamt.de/EN/Tasks/markettransparencyunit_fuels/markettransparencyunit_fuels.html" target="_blank" rel="noopener">https://www.bundeskartellamt.de/EN/Tasks/markettransparencyunit_fuels/markettransparencyunit_fuels.html</a>.</p>
Extended data 'It's become a theatre': relational experiences of family carers and people with Amyotrophic lateral sclerosis (ALS) after cognitive impairment emerges [Version 2]
<p>This upload contains suplimentary files to the research article ‘It’s become a theatre’: relational experiences of family carers and people with Amyotrophic lateral sclerosis (ALS) after cognitive impairment emerges [Version 2]</p>
Tara Pacific samples provenance and environmental context - version 2
<p>This publication includes the provenance metadata and environmental context of all samples generated by the Tara Pacific Expedition. The metadata fields and parameters are detailed in the readme files. Provenance is given in a single UTF-8 encoded tab-separated-values file. Environmental context is provided in eleven UTF-8 encoded tab-separated-values files, all with the same structure, but each providing a different statistic: </p> <ul> <li>"n" = number of values</li> <li>"mean" = mean value</li> <li>"stdev" = standard deviation</li> <li>"P05" = 5 percentile, i.e. minimum (Q0)</li> <li>"P25" = 25 percentile, i.e. first quartile (Q1)</li> <li>"P50" = 50 percentile, i.e. median (Q2)</li> <li>"P75" = 75 percentile, i.e. third quartile (Q3)</li> <li>"P95" = 95 percentile, i.e. maximum (Q4)</li> <li>"dt" = lag in time, i.e. difference between the collection date/time of the sample and that of the environmental context provided</li> <li>"dxy" = lag in horizontal space, i.e. distance between the collection location of the sample and that of the environmental context provided</li> <li>"dz" = lag in vertical space, i.e. difference between the collection depth/altitude of the sample and that of the environmental context provided</li> </ul> <p>Missing value terms are:</p> <ul> <li>"nav" = not-available, i.e. the expected information is not given because it has not been collected or generated</li> <li>"npr" = not-provided, i.e. the expected information has been collected or generated but it is not given, i.e. a value may be available in a later version or may be obtained by contacting the data providers</li> <li>"nac" = confidential, i.e. the expected information has been collected or generated but is not available openly because of privacy concerns</li> <li>"nap" = not-applicable, i.e. no information is expected for this combination of parameter, environment and/or method, e.g. depth below seabed cannot be informed for a sample collected in the water or the atmosphere</li> </ul>
Map of built-up expansion ("nedbygging") over Norway 2017-2022 version 2
<p>Version 2 of the dataset https://zenodo.org/records/10566644</p> <p>Changes from first version include:</p> <ul> <li>added crowdsourced verification labels to the dataset gathered from the interactive app (link below) explained here: https://www.nina.no/Om-NINA/Aktuelt/Nyheter/article/kartlegg-nedbygging-av-natur-selv</li> <li>added the year of change crowdsourced labels</li> <li>added the type of built-up expansion as labelled by the NRK team</li> </ul> <p>Data can be viewed interactively here: <a href="https://nina.earthengine.app/view/nedbygging">https://nina.earthengine.app/view/nedbygging</a></p> <h4>(see Norwegian description below)</h4> <h2> 1. Dataset Information</h2> <p> - Title: Map of built-up expansion over Norway 2017-2022</p> <p> - Author(s): Zander Venter (NINA), Mads Nyborg Støstad (NRK), Ruben Solvang (NRK), Anne Linn Kumano-Ensby (NRK), Su Thet Mon (NRK)</p> <p> - Contact Information: zander.venter@nina.no</p> <p> - Date of Data Generation: 06.01.2024</p> <p> - Version: 1</p> <p> - Description: This is the dataset used in the <a href="https://www.nrk.no/dokumentar/xl/nrk-avslorer_-44.000-inngrep-i-norsk-natur-pa-fem-ar-1.16573560">NRK article</a> published on 06.01.2024. The data contains polygons outlining potential “nedbygging” (hereafter translated to “built-up expansion” in English) events between 2017 and 2022 over Norway. The built-up expansion polygons were identified using a combination of Sentinel-2 satellite imagery, a fully convolutional neural network (a type of AI model) from Google called <a href="https://dynamicworld.app/">Dynamic World</a> and NINA’s time series analysis thereof. The method to create the map will be published by NINA at a later date. The original map was created by NINA, but NRK performed some post-processing which included joining some polygons which were part of the same built-up expansion event (e.g. a long road). It is important to note that the map is a result of AI and has errors in it. Therefore, users are encouraged to read the sections on data quality and usage information below. Users can refer to <a href="https://www.sciencedirect.com/science/article/pii/S2212041624000056">Venter et al. (2024)</a> for details on the scientific best practice which the NRK journalists followed to ensure that their reported area estimates in the article were not biased. In summary, the map is wrong 18% of the time. Users should expect to find that on average 1 in 5 square meter is incorrectly identified as built-up expansion. There are also many instances of built-up expansion which will be missed in the map such as forestry road development, building of small cabins etc. </p> <h2> 2. File Details</h2> <p> - Format: Shapefile (.shp, .shx, .dbf, .prj)</p> <p> - Size: 13.27 MB</p> <h2> 3. Geospatial Information</h2> <p> - Coordinate System: EPSG:32632, UTM zone 32N</p> <p> - Spatial Resolution: 10m</p> <p> - Geographical Coverage: Norway mainland (excludes Svalbard)</p> <p> - Temporal Coverage: 2017 to 2022</p> <h2> 4. Data Content</h2> <p> - Attributes Included:</p> <p> - *id*: unique identity number for each polygon</p> <p> - *undersøkt*: whether the polygon has been investigated manually using visual interpretation of orthophotos. “ja” = “yes” and “nei” = “no”</p> <p> - *<span><span>undersøkt_source*: whether the data was collected by the NRK team or the crowdsourcing effort</span></span></p> <p><span><span> - *</span></span><span><span>kategori_1*: the type of built-up expansion labelled by the NRK team - see Google Translate for translations</span></span></p> <p><span><span> - *year*: the year in which the built-up expansion occurred as defined by the crowdsourcing volunteers</span></span></p> <p> - *ai_feil*: whether the AI model method correctly (“riktig”) or incorrectly (“feil”) identified natural habitat conversion to built-up surface. Values where *undersøkt* == “nei” are labelled as “ikke_verifisert” </p> <h2> 5. Data Quality</h2> <p> - Accuracy: As described above, the false positive rate of the map was 18% based on 500 locations used for map validation and accuracy assessment. We did not quantify a false negative rate and balanced accuracy estimates because this would have required a denser sample for manual verification. Therefore, it is likely that there are many instances of built-up expansion that our map does not capture. After the formal accuracy assessment using the 500 stratified random points, NRK verified additional polygons (total of 3875) in the dataset during their investigative journalism workflow. Although these were not collected in a systematic manner, then can still be useful for some downstream tasks such as exploring what causes the AI model to misidentify built-up expansion.</p> <p> - Validation Methods: A design-based approach was used to quantify map accuracy and estimate uncertainty around the resulting area estimate reported in the NRK article. The details of this method are reported in <a href="https://www.sciencedirect.com/science/article/pii/S2212041624000056">Venter et al. (2024)</a>. This approach quantifies the error in the AI-derived map, and corrects for this using a stratified area estimator. Therefore, the total built-up expansion of 208 km<2> reported in the NRK article has been bias-corrected. We also quantified 95% confidence intervals around this are estimate of 9.8 km<2>. It is important to note that the validation approach was conducted on individual Sentinel-2 pixels of 10x10m and not at the polygon level. Therefore, we did not quantify the error in the precision of the polygon shape in terms of capturing the full extent of a given built-up expansion event.</p> <h2> 6. Usage Information</h2> <p> - Use Limitations: Considering the map error described above, users should proceed with caution when analysing the map to derive area statistics or overlays with other maps. As described in <a href="https://www.sciencedirect.com/science/article/pii/S2212041624000056">Venter et al. (2024)</a>, simply adding the areas of the polygons (or “pixel counting” with maps formatted as images) without accounting for the error in the map will lead to incorrect area statistics. We recommend that users validate the map for their municipality or study area before proceeding with analysis. It is likely that the margin of error is highly variable between municipalities. For example, although we have not quantified it, we noticed many AI mistakes in mountainous regions due to snow and ice interference and therefore high-altitude municipalities might have more errors than low-altitude ones.</p> <p> </p> <h1> Norwegian description: </h1> <h2> 1. Datasettinformasjon</h2> <p> - Tittel: Kart over nedbygging over Norge 2017-2022</p> <p> - Forfatter(e): Zander Venter (NINA), Mads Nyborg Støstad (NRK), Ruben Solvang (NRK), Anne Linn Kumano-Ensby (NRK), Su Thet Mon (NRK)</p> <p> - Kontaktinformasjon: zander.venter@nina.no</p> <p> - Dato for datagenerering: 06.01.2024</p> <p> - Versjon: 1</p> <p> - Beskrivelse: Dette er datasettet som brukes i <a href="https://www.nrk.no/dokumentar/xl/nrk-avslorer_-44.000-inngrep-i-norsk-natur-pa-fem%20-ar-1.16573560">NRK-artikkelen</a> publisert 06.01.2024. Dataene inneholder polygoner som skisserer potensiell nedbygging mellom 2017 og 2022 over Norge. Nedbyggingsområdene ble identifisert ved hjelp av en kombinasjon av Sentinel-2 satellittbilder, et fullstendig konvolusjonelt nevralt nettverk (en type KI-modell) fra Google kalt <a href="https://dynamicworld.app/">Dynamic World</a> og NINAs tidsserie-analyse av dette. Metoden for å lage kartet vil bli publisert av NINA på et senere tidspunkt. Det originale kartet ble laget av NINA, men NRK utførte en del etterbehandling som inkluderte sammenføyning av noen polygoner som var en del av den samme oppbygde utvidelseshendelsen (f.eks. en lang vei). Det er viktig å merke seg at kartet er produsert ved hjelp av kunstig intelligens og inneholder feil. Derfor oppfordres brukere til å lese avsnittene om datakvalitet og bruksinformasjon nedenfor. Brukere kan referere til <a href="https://www.sciencedirect.com/science/article/pii/S2212041624000056">Venter et al. (2024) </a>for detaljer om den vitenskapelige beste praksisen som NRK-journalistene fulgte for å sikre at deres rapporterte arealstatistikk i artikkelen er korrekt. Oppsummert er 18 % av arealet i kartet feil. Brukere bør forvente å finne at i gjennomsnitt 1 av 5 kvadratmeter er feilaktig identifisert som nedbygging. Det er også mange tilfeller av nedbygging som som ikke vil vises i kartet, som skogsveiutbygging, bygging av småhytter mm.</p> <h2> 2. Fildetaljer</h2> <p> - Format: Shapefil (.shp, .shx, .dbf, .prj)</p> <p> - Størrelse: 13,27 MB</p> <h2> 3. Geospatial informasjon</h2> <p> - Koordinatsystem: EPSG:32632, UTM-sone 32N</p> <p> - Rolig oppløsning: 10m</p> <p> - Geografisk dekning: Norges fastland (ekskluderer Svalbard)</p> <p> - Tidlig dekning: 2017 til 2022</p> <h2> 4. Datainnhold</h2> <p> - Attributter inkludert:</p> <p> - *id*: unikt identitetsnummer for hver polygon</p> <p> - *undersøkt*: om polygonet er undersøkt manuelt ved bruk av visuell tolkning av ortofoto.</p> <p> - *undersøkt_source*: om dataene er samlet inn av NRK-teamet eller crowdsourcing-innsatsen</p> <p> - *kategori_1*: typen nedbygging merket av NRK-teamet </p> <p> - *year*: året hvor nedbygging skjedde som definert av crowdsourcing</p> <p> - *ai_feil*: om AI-modellmetoden var “riktig” eller “feil”. Verdier der *undersøkt* == «nei» er merket som «ikke_verifisert»</p> <h2> 5. Datakvalitet</h2> <p> - Nøyaktighet: Som beskrevet ovenfor var andelen falske positive punkter i kartet 18 % basert på 500 steder (prøveflater) brukt for kartvalidering og nøyaktighetsvurdering. Vi kvantifiserte ikke andelen falske negative punkter og balanserte nøyaktighetsestimater, fordi dette ville ha krevd en tettere stikkprøvedensitet for manuell verifisering. Derfor er det sannsynlig at det er mange tilfeller av nedbygging som kartet vårt ikke fanger opp. Etter den formelle nøyaktighetsvurderingen ved bruk av 500 stratifiserte tilfeldige prøveflater, verifiserte NRK ytterligere polygoner (totalt 3875) i datasettet i løpet av deres journalistiske undersøkelser. Selv om disse ikke ble samlet inn på en systematisk måte, kan de fortsatt være nyttige for noen oppfølgingsanalyser som å utforske hva som får AI-modellen til å feilidentifisere nedbygging.</p> <p> - Valideringsmetoder: En designbasert tilnærming («design-based area estimation» på engelsk) ble brukt for å kvantifisere kartnøyaktighet og estimere usikkerhet rundt det resulterende arealestimatet rapportert i NRK-artikkelen. Detaljene ved denne metoden er forklart i <a href="https://www.sciencedirect.com/science/article/pii/S2212041624000056">Venter et al. (2024)</a>. Denne tilnærmingen kvantifiserer feilen i det KI-avledede kartet, og korrigerer for dette ved å bruke en stratifisert arealestimator. Derfor er den totale bebygde utvidelsen på 208 km<2> som er rapportert i NRK-artikkelen, skjevhetskorrigert. Vi kvantifiserte også 95 % konfidensintervaller rundt dette er estimat på 9,8 km<2>. Det er viktig å merke seg at valideringstilnærmingen ble utført på individuelle Sentinel-2 piksler på 10x10m og ikke på polygonnivå. Derfor kvantifiserte vi ikke feilen i presisjonen til polygonformen når det gjelder å fange opp hele omfanget av en gitt oppbygget ekspansjonshendelse.</p> <h2> 6. Bruksinformasjon</h2> <p> - Bruksbegrensninger: Med tanke på kartfeilen beskrevet ovenfor, bør brukere fortsette med forsiktighet når de analyserer kartet for å beregne områdestatistikk eller overlegg med andre kart. Som beskrevet i <a href="https://www.sciencedirect.com/science/article/pii/S2212041624000056">Venter et al. (2024)</a>, ved å legge til områdene til polygonene (eller «pikseltelling» med kart formatert som bilder) uten å ta hensyn for feilen i kartet vil føre til feil arealstatistikk. Vi anbefaler at brukere validerer kartet for sin kommune eller studieområde før de går videre med analyse. Det er sannsynlig at feilmarginen varierer mye mellom kommuner. For eksempel, selv om vi ikke har kvantifisert det, la vi merke til mange AI-feil i fjellområder på grunn av snø- og is, og derfor kan kommune med mye fjell ha flere feil enn de langs kysten (for eksempel).</p>
Figure 2. (a) Representation of laser servo-driver for inverse kinematics analysis; (b) Representation of the lag angle, B, of the internal servomechanism (magnified version of the chin-rest).-Design of a Novel Servo-motorized Laser Device for Visual Pathways Diseases Therapy
<p>As the servo-driver will be attached in the chin-rest in a non-central area with respect to the<br> semispherical structure shown in Figure 1(a), it is necessary to calculate a lag angle, according to<br> the measurements from the chin-rest, see Figure 2(b). This was done using a hybrid formula based<br> on the law of cosines,</p>
Example data for "Sunbeam: an extensible pipeline for analyzing metagenomic sequencing experiments" [Version 2]
<p>This repository contains the example datasets analyzed in the Sunbeam paper, version 2. Please see the current <a href="http://sunbeam.readthedocs.io/en/latest/quickstart.html">Sunbeam Quickstart Guide</a> for up-to-date instructions on installing and running Sunbeam.</p>
The TRIple-frequency and Polarimetric radar Experiment for improving process observation of winter precipitation (version 2)
<p>The combined TRIple-frequency and Polarimetric radar Experiment for improving process observation of winter precipitation (TRIPEx) was a joint field experiment of the University of Cologne, the University of Bonn, the Karlsruhe Institute of Technology (KIT), and the Research Center Jülich. TRIPEx took place at the Jülich Observatory for Cloud Evolution (JOYCE) from 11 November 2015 until 04 January 2016. During this experiment, the X, Ka and W Band ground-based Doppler radars were used vertically pointing to observe the clouds. Here we provide level 2 of the dataset collected during this campaign. Several step processing were applied to minimize the radar offset and attenuation. In addition, we provide the attenuation correction and the quality flags for each processing steps to allow the user to retrieve the data without our correction. The raw and the level 1 of the dataset are available for the users on request from the corresponding author.</p>
Text-fig. 10. Phylogenetic relationships of Miocene hyaenodonts (for definitions of character states see Table 2). The data matrix was compiled in MacClade 4.05 and run in PAUP 4.0b10 (Macintosh version). We chose Cimolestes magnus CLEMENS et RUSSELL, 1965, (additional data from Lillegraven 1969), as the outgroup. The unordered and unweighted analysis produced 16 trees. a: Majority-rule consensus. b: Strict consensus. Consistency index (CI): 0.5882; Homoplasy index (HI): 0.4118; Retention index (RI): 0.7742. in New Hyaenodonts (Ferae, Mammalia) From The Early Miocene Of Napak (Uganda), Koru (Kenya) And Grillental (Namibia)
Text-fig. 10. Phylogenetic relationships of Miocene hyaenodonts (for definitions of character states see Table 2). The data matrix was compiled in MacClade 4.05 and run in PAUP 4.0b10 (Macintosh version). We chose Cimolestes magnus CLEMENS et RUSSELL, 1965, (additional data from Lillegraven 1969), as the outgroup. The unordered and unweighted analysis produced 16 trees. a: Majority-rule consensus. b: Strict consensus. Consistency index (CI): 0.5882; Homoplasy index (HI): 0.4118; Retention index (RI): 0.7742.
Softcite Dataset Version 2
<p>This is the version 2.0 of the Softcite Dataset, a corpus of currently 4971 scientific articles with software mention annotations. This is a gold standard corpus, resulting from multi-stage annotations by a team of annotators and reconciliation phases by curators to solve disagreements. The dataset is available under CC-BY license.</p> <p>For the first versions of this dataset, see <a href="https://github.com/howisonlab/softcite-dataset">here</a> and <a href="https://zenodo.org/record/4445202">here</a>. This new version is dedicated to new annotation iterations on the dataset and is independent from the previous repositories for simplification.</p> <p>The working space for this dataset is at <a href="https://github.com/softcite/softcite_dataset_v2">https://github.com/softcite/softcite_dataset_v2</a></p> <p><strong>Description of the dataset</strong></p> <p>The Softcite dataset consist of the 4,971 full-texts in English (available in Open Access under CC-BY license), half in Life Sciences and half in Economics, for a total of around 46 million tokens.</p> <p>Annotations from the previous version of the dataset (v1.0) and this new release (v2.0) are summarized below:</p> <table> <thead> <tr> <th>Softcite dataset version</th> <th>v1.0 (2020)</th> <th>v2.0 (2023)</th> </tr> </thead> <tbody> <tr> <td>number of documents</td> <td>4,971</td> <td>4,971</td> </tr> <tr> <td>---</td> <td>---</td> <td>---</td> </tr> <tr> <td>software name (total)</td> <td>4,093</td> <td>5,134</td> </tr> <tr> <td>- environment</td> <td> </td> <td>1,089</td> </tr> <tr> <td>- component</td> <td> </td> <td>88</td> </tr> <tr> <td>- implicit</td> <td> </td> <td>106</td> </tr> <tr> <td>---</td> <td>---</td> <td>---</td> </tr> <tr> <td>version</td> <td>1,258</td> <td>1,478</td> </tr> <tr> <td>publisher</td> <td>1,111</td> <td>1,311</td> </tr> <tr> <td>URL</td> <td>172</td> <td>231</td> </tr> <tr> <td>programming language</td> <td> </td> <td>71</td> </tr> </tbody> </table> <p>The additional software mentions were spotted in the articles with automatic and manual screening. They were then validated via the normal double process with reconciliation in case of disagreement.</p> <p>The refinement of the type of mentioned software and the encoding of the possible relationships between software mentions in the same paragraph have been realized with the same gold-standard annotation approach.</p> <p><strong>Guidelines</strong></p> <p>The attached XML annotation guidelines describe the different mark-up and the annotation principles (annotation_guidelines_tei_xml.md).</p> <p><strong>Files</strong></p> <p>The version 2.0 of the Softcite dataset contains the following resources:</p> <p>1. Under the <code>xml/</code> subdirectory all the XML annotated corpus:</p> <ul> <li><code>softcite_corpus-full.tei.xml</code>: the dataset as a corpus with one TEI entry per document and paragraphs containing one software mention or more.</li> <li><code>softcite_corpus-holdout-full.tei.xml</code>: for evaluation purpose, the so-called <code>holdout set</code> corresponding to 20% of the full texts with complete text content and software mentions. This holdout set represents a real distribution of mentions in papers and is, therefore, appropriate for evaluation.</li> <li><code>softcite_corpus-working.tei.xml</code>: the subset of the corpus excluding the 20% of the full texts of the holdout set, for evaluation purposes.</li> </ul> <p>2. The <code>json/</code> subdirectory contains converted JSON files for the XML corpus. The JSON format is provided for users more comfortable with JSON than XML. The name of the files is similar as for the above XML files but with <code>.json</code> extension. The JSON uses offsets for identifying the position of the annotation spans in paragraphs, which makes it less readable.</p> <p><strong>Script</strong></p> <p>We include a Python script used to convert the master TEI XML corpus into JSON format under <code>scripts/TEI2LossyJSON.py</code></p> <p>Use like this:</p> <pre>> python3 scripts/TEI2LossyJSON.py --tei-file xml/softcite_corpus-full.tei.xml --output json/</pre> <p><strong>Acknowledgement</strong></p> <p>We thank Alfred P. Sloan Foundation and NextGenerationEU/France Relance for supporting this work. We also thank our collaborators and student annotators for making this dataset gold-standard and available.</p> <p> </p>
Benchmark for Pairs of Papers in Semantic Scholar: 1 hop vs. 2-4 hops version 0.0
<p><strong>Benchmark for Pairs of Papers in Semantic Scholar: 1 hop vs. 2-4 hops (version 0.0)</strong></p> <p>There are two files: valid.txt and test.txt; both files use the same format.</p> <p>Columns 2 and 3 are corpus ids from Semantic Scholar.</p> <p>Column 1 is the distance between the two papers in the citation index.</p> <p>Columns 4 and 5 are the bins of the two paper, respectively. The bin is a number between 0 and 100. Papers are sorted by publication date. There are about 2M papers per bin, with the oldest papers in bin 0, and the newest papers in bin 99.</p> <p>Bin 100 is a catch-all for papers with unknown publication dates.</p> <p>head valid.txt</p> <p>1 248518397 1041744 97 51</p> <p>2 248518397 23848439 97 21</p> <p>3 248518397 4235810 97 12</p> <p>4 248518397 82079949 97 11</p> <p>1 3374228 140728989 79 0</p> <p>1 68334187 36144275 58 34</p> <p>2 68334187 7008060 58 4</p> <p>1 205881482 94036919 77 72</p> <p>2 205881482 95069173 77 53</p> <p>3 205881482 53480264 77 52</p> <p>Each row is assigned to a bin, B, where B = max(col4, col5).</p> <p> </p> <p><strong>Task</strong>: the task is to distinguish pairs of papers with distance == 1 from pairs of papers with distance > 1.</p> <p><strong>Test/Train splits</strong>: For all thresholds, 0 <= T_{train} <= 99, train a model on rows in bins between 0 and T_{train} (inclusively). Test these models on rows in all bins 0 <= T_{test} <= 99. Report average accuracy for all combinations of T_{train} and T_{test}.</p> <p> </p> <p>Average Accuracy is defined as: mean(Predict(row) == 1, Gold(row) == 1)</p> <p>The means are computed over rows in a test bin.</p> <p> </p>
Cambridge butterfly wing collection batch 1- version 2
<p>EN:</p> <p>This upload contains photographs taken by Eva Whiltshire in the Butterfly Genetics Group at the University of Cambridge from the 10th October 2017 until the 9th March 2018. This second version has labelling errors fixed.</p> <p>Subcollections found in this batch:</p> <ul> <li>Patricio Salazar's wild specimen collection mostly across the H. m. plesseni/malleti and H. e. notabilits/lativitta hybrid zones in the Eastern slope of the Andes collected in 2009 - 2011.</li> </ul> <p>ID range:</p> <p>CAM016006 - CAM017987</p> <p>Nomenclature</p> <ul> <li>CAMXXXXXX : unit ID corresponding to individual samples</li> <li>_v _d: ventral or dorsal</li> </ul> <p>Information on individual samples from the Butterfly Genetics Group Collection can be found on the public database Earthcape (click <a href="https://heliconius.ecdb.io/default.aspx">here for the database</a>, and <a href="http://heliconius.zoo.cam.ac.uk/databases/earthcape-specimen-database/">here for FAQ</a>)</p> <p>Please contact Chris Jiggins (c.jiggins[at]zoo.cam.ac.uk), Gabriela Montejo-Kovacevich (mgm49[at]cam.ac.uk) or Ian Warren (iaw22[at]cam.ac.uk) for requests.</p> <p> </p> <p>------------------------------------------------------</p> <p>ES:</p> <p>Este repositorio contiene fotografías tomadas por Eva Whiltshire en el Butterfly Genetics Group de la Universidad de Cambridge desde el 10 de octubre de 2017 hasta el 9 de marzo de 2018. Esta segunda version no contiene errores de nombres de archivos.</p> <p>Subcolecciones encontradas en este lote:</p> <ul> <li>Colecciones de Gabriela Montejo Kovacevich y colegas de Mocoa (Colombia), vertientes oriental y occidental de los Andes en Ecuador (provincias de Napo y Pichincha) de 2017 y 2018.</li> <li>La colección de especímenes silvestres de Patricio Salazar principalmente en la zona híbrida y alrededores de H. m. plesseni / malleti y H. e. notabilits / lativitta en la vertiente oriental de los Andes recogidas en 2009 - 2011.</li> </ul> <p>Nomenclatura</p> <ul> <li>CAMXXXXXX: ID de unidad correspondiente a muestras individuales</li> <li>_v _d: ventral o dorsal</li> </ul> <p>Puede encontrar información sobre muestras individuales de Butterfly Genetics Group Collection en la base de datos pública Earthcape (haga clic <a href="https://heliconius.ecdb.io/default.aspx">aquí para la base de datos</a>, y <a href="http://heliconius.zoo.cam.ac.uk/databases/earthcape-specimen-database/">aquí para preguntas frecuentes</a>)</p> <p>Por favor, póngase en contacto con Chris Jiggins (c.jiggins [arroba] zoo.cam.ac.uk), Gabriela Montejo-Kovacevich (mgm49 [arroba] cam.ac.uk) o Ian Warren (iaw22 [arroba] cam.ac.uk) con sus preguntas o peticiones.</p>
FoodOntoMap version 2: Linking Food Concepts across different Food Ontologies
<p>A dataset providing food concept normalization using different food ontologies. There are eight data sets which describe the unique food concepts from each ontology, and one main file which provides the mapping between the different ontologies. All files are in two formats (.csv, .xlsx).</p> <p>The prefixes for each dataset are as follows:</p> <ol> <li>"A" - Hansard Corpus</li> <li>"B" - FOODON</li> <li>"C" - SNOMEDCT</li> <li>"D" - OF</li> <li>"E" - RCD</li> <li>"F" - MESH</li> <li>"G" - SNMI</li> <li>"H" - NDDF<br> </li> </ol>
Flow of Agricultural Nitrogen, version 2 (FANv2): Model input and output data
<p>This upload includes data associated with the manuscript "An improved mechanistic model for ammonia volatilization in Earth system models: Flow of Agricultural Nitrogen, version 2 (FANv2)" submitted to Geoscientific Model Development. The dataset includes an input file for use with the Community Land Model, and an output file with the simulated ammonia emissions for the agricultural sector. The emissions are monthly averages from the simulation for 2010-2015. Additional information is given in the readme file.</p>
Statue am St. Josef-Stift Celle (Version 2)
**Statue am ehemaligen Krankenhaus St. Josef-Stift in Celle | Statue at the former St. Josef-Stift Hospital in Celle** Die Statue mit einem Heiligenbildnis befindet sich am Gebäude des 1883 errichteten katholischen St. Josef-Stifts, eines ehemaligen Krankenhauses in der Innenstadt von Celle. Weitere Informationen: | Further information: Durch eine Fusion mit dem Alggemeinen krankenhaus (AKH) sollte das angeschlagene Celler St. Josef-Stift gerettet werden – erfolglos. Heute erfindet sich das AKH neu, und die Statue des Schutzpatrons Josef hat wie der Kapitän eines sinkenden Schiffs als letzter den Stift-Standort am Bullenberg verlassen. [www.cz.de](https://www.cz.de/Celle/Aus-der-Stadt/Celle-Stadt/Stadt-moechte-Hotel-am-Ort-des-Celler-St.-Josef-Stifts) Aufnahmen von | captured by: Jessica, Roya, Ziva & Shannon 28.03.2022 Dank an | Thanks [kulturschokolade.org](https://sketchfab.com/3dtwins) für das gemeinsame Projekt! Source: Objaverse 1.0 / Sketchfab
Stratford Cocks Comb Scan Version 2
Cocks-comb crested tiles such as this, cut using a knife prior to firing, would have given the roof ridge of New Place a distinct appearance at the time of Hugh Clopton and William Shakespeare. More information at: www.searchingforshakespeare.co.uk Source: Objaverse 1.0 / Sketchfab
Ceramic sculpture of Xolo, version 2
1923.06.0545 :: figur: hund, Lergodsfigur. Stor hund av lergods med tjock mage och knubbiga ben. Beträffande dessa hundar, som redan Hernandez (1651) beskrev från Michuacan, och vilka troligen härstamma från taxen, se Caecilie Seler: Auf alten Wegen in Mexico und Guatemala sid. 351/2. Hunden är jämte kalkonen mexicanernasenda husdjur och spelar en stor roll i detta folks religiösa liv. Hundar av rödgul färg voro gravgåvor hos aztekerna, på det att dessa djur skulle föra dem över de nio underjordiska strömmarna. Hos Maya ansågs hunden som majsbringare och vissa årsfester frambars hundar som offer, gjorda av lergods, vilka på ryggen buro majskakor. Hos atlantkustens stammar var hunden ett vanligt offerdjur, vilket bevisas av bilderna i Codex Nuttall fol. 17 och 69. Möjligen äro samma tankar förbundna med lerhundarna från Colima. Orig. nummer IV Ca 21523. 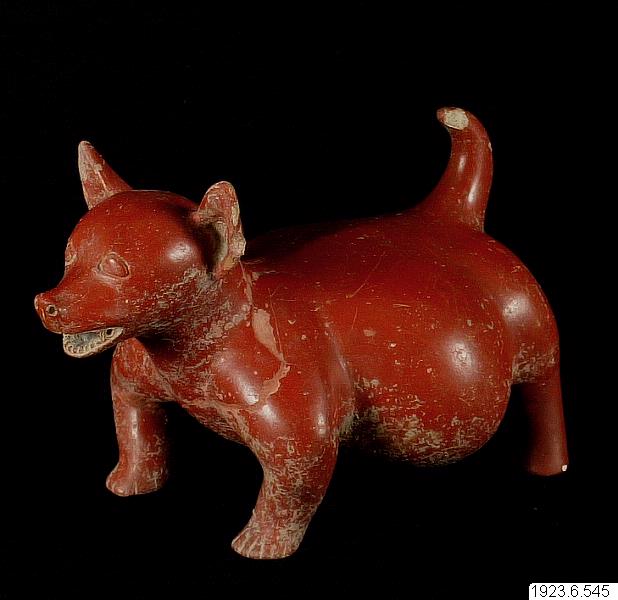 Source: Objaverse 1.0 / Sketchfab
Star Formation In Nearby Clouds (SFiNCs): X-ray And Infrared Source Catalogs And Membership. SPCM Atlas Dataset (Version 2).
<p>The SPCM (SFiNCs Possible Cluster Member) Atlas dataset accompanies the article entitled ``Star Formation In Nearby Clouds (SFiNCs): X-ray And Infrared Source Catalogs And Membership,'' by Getman, Broos, Kuhn, Feigelson, Richert, Ota, Bate, and Garmire, to appear in The Astrophysical Journal Supplement Series. The paper is also available on-line on astro-ph at: https://arxiv.org/abs/1612.05282 . SPCM Atlas is a collection of 25 PDF files. Four pdf files are associated with the SFiNCs star forming region (SFR) Cep OB3b, and 21 pdf files are associated with the remaining 21 SFiNCs SFRs. Full description of SPCM Atlas is given in the Appendix B section of the article. This is an update of the previous zenodo.231216 upload. This update includes revised PDF atlases for Be59 and IC348 (with revised vales of the SED slope and [3.6] and [4.5]-band magnitudes).</p>
Version 2 (20170523) of the MALDI-TOF Mass Spectrometry Database for Identification and Classification of Highly Pathogenic Microorganisms from the Robert Koch-Institute (RKI)
<p><em>(Version </em>20170523<em>) </em></p> <p><strong><em>Edit #1 (Nov 30, 2018): New database version (v.3 - 20181130) - available</em>: </strong> <a href="https://doi.org/10.5281/zenodo.1880975">10.5281/zenodo.1880975</a></p> <p><strong><em>Edit #2 (Mar 06, 2023): New database version (v.4.2 - 20230306) - available</em>: </strong> <a href="https://zenodo.org/records/14562231">10.5281/zenodo.7702375</a></p> <p>Version 2 (20170523) of the RKI’s MALDI-TOF mass spectral database is an update of the original database (version 20161027, https://doi.org/10.5281/zenodo.163517). The RKI database contains mass spectral entries from highly pathogenic (biosafety level 3, BSL-3) bacteria such as <em>Bacillus anthracis</em>, <em>Yersinia pestis</em>, <em>Burkholderia mallei</em>, <em>Burkholderia pseudomallei</em> and <em>Francisella tularensis</em> as well as a selection of spectra from their close and more distant relatives. The database can be used as a reference for the diagnostics of BSL-3 bacteria using proprietary and free software packages for MALDI-TOF MS-based microbial identification. Spectral data are distributed as a 7-zip archive that contains the original mass spectra in its native data format (Bruker Daltonics). Please refer to the pdf file (170523-ZENODO-Metadata.pdf) to obtain information on the metadata of the spectra. Do not try to print this document (~1100 pages!)</p> <p>The pkf-file (170523_ZENODO_Peaklist_30Peaks_1.6.pkf) contains the MS peak list data in a Matlab compatible format. The latter data file can be imported into MicrobeMS, a Matlab-based free-of-charge software solution developed at RKI. MicrobeMS is available from http://www.microbe-ms.com.</p> <p>The RKI mass spectral database will be updated on a regular basis.</p> <p>The author's grateful thanks are given to the following persons for providing microbial strains and species. Without their help this work would not be possible.</p> <ul> <li><strong>Wolfgang Beyer</strong> - University of Hohenheim, Faculty of Agricultural Sciences, Stuttgart, Germany</li> <li><strong>Guido Werner</strong> - Robert Koch-Institute, <em>Nosocomial Pathogens and Antibiotic Resistances</em> (FG13), Wernigerode, Germany</li> <li><strong>Alejandra Bosch</strong> - <em>CINDEFI, CONICET-CCT</em> La Plata, Facultad de Ciencias Exactas, Universidad Nacional de La Plata, La Plata, Buenos Aires, Argentina</li> <li><strong>Michal Drevinek</strong> - National Institute for Nuclear, Biological and Chemical Protection, Milin, Czech Republic</li> <li><strong>Roland Grunow</strong> - Robert Koch-Institute, <em>Highly Pathogenic Microorganisms</em> (ZBS2), Berlin, Germany</li> <li><strong>Daniela Jacob</strong> - Robert Koch-Institute, <em>Highly Pathogenic Microorganisms</em> (ZBS2), Berlin, Germany</li> <li><strong>Silke Klee</strong> - Robert Koch-Institute, <em>Highly Pathogenic Microorganisms</em> (ZBS2), Berlin, Germany</li> <li><strong>Jörg Rau</strong> - Chemisches und Veterinäruntersuchungsamt Stuttgart, Fellbach, Germany</li> <li><strong>Jens Jacob</strong> - Robert Koch-Institute, <em>Hospital Hygiene, Infection Prevention and Control </em>(FG14), Berlin, Germany</li> <li><strong>Martin Mielke</strong> - Robert Koch-Institute, <em>Department 1 - Infectious Diseases</em>, Berlin, Germany</li> <li><strong>Monika Ehling-Schulz</strong> - Functional Microbiology, Institute of Microbiology, University of Veterinary Medicine, Vienna, Austria</li> <li><strong>Armand Paauw</strong> - Department of Medical Microbiology, CBRN protection, Universitair Medisch Centrum Utrecht, TNO, Rijswijk, The Netherlands</li> </ul>
ScienceDex guides
Understand access before you commit
These curated guides explain access requirements, typical timelines, costs, and reuse considerations for widely used research datasets.
Allen Brain Atlas
Allen Brain Atlas is an Allen Institute collection of brain map atlases, datasets, APIs, and analysis tools covering mouse, human, and non-human primate brain resources.
Annotated Behaviour and Observability Dataset (ABODe)
ABODe is a University of Edinburgh DataShare dataset for behavior classification in group-housed mice using home-cage video, identities, bounding boxes, ground-plate positions, and annotator labels.
DANDI Archive for NWB datasets
DANDI is a BRAIN Initiative archive for publishing and sharing neurophysiology data, including electrophysiology, optophysiology, and behavioral data packaged as NWB and related standards.
International Brain Laboratory public data
The International Brain Laboratory public data releases expose standardized mouse decision-making experiments, including Neuropixels recordings, widefield calcium imaging, behavior, and session metadata accessed through the ONE API.
OpenNeuro
OpenNeuro is a free, open platform for sharing neuroimaging datasets, with public search, dataset pages, and download paths for web, S3, DataLad, and the OpenNeuro CLI.