
Find research datasets worth reusing
Search datasets from major research repositories and use ShareScore to quickly assess how well each record supports discovery, access, and reuse.
2,288
datasets available to search
ShareScore release 0.9.0
Dataset results
2,288 results for “period”
Data from: What makes a good pollinator? Abundant and specialized insects with long flight periods transport the most strawberry pollen
<ol> <li>Despite the importance of insect pollination to produce marketable fruits, insect pollination management is limited by insufficient knowledge about key crop pollinator species. This lack of knowledge is due in part to: 1) the extensive labour involved in collecting direct observations of pollen-transport, 2) the variability of insect assemblages over space and time, and 3) the possibility that pollinators may need access to wild plants as well as crop floral resources.</li> <li>We address these problems using strawberry in the UK as a case study. First, we compare two proxies for estimating pollinator importance: flower visits and pollen transport. Pollen-transport data might provide a closer approximation of pollination service, but visitation data are less time-consuming to collect. Second, we identify insect parameters that are associated with high importance as pollinators, estimated using each of the proxies above. Third, we estimated insects' use of wild plants as well as the strawberry crop.</li> <li>Overall, pollinator importances estimated based on easier-to-collect visitation data were strongly correlated with importances estimated based on pollen loads. Both frameworks suggest that bees <em>Apis</em> and <em>Bombus</em> and hoverflies <em>Eristalis</em> are likely to be key pollinators of strawberries, although visitation data underestimate the importance of bees.</li> <li>Moving beyond species identities, abundant, relatively specialised insects with long active periods are likely to provide more pollination service. </li> <li>Most insects visiting strawberry plants also carried pollen from wild plants, suggesting that pollinators need diverse floral resources.</li> <li>Identifying essential pollinators or pollinator parameters based on visitation data will reach the same general conclusions as those using pollen transport data, at least in monoculture crop systems. Managers may be able to enhance pollination service by preserving habitats surrounding crop fields to complement pollinators' diets and provide habitats for diverse life stages of wild pollinators.</li> </ol>
Large-scale restoration of species-rich dry grasslands on arable land: Environmental filtering drives successful species establishment over a period of 10 years
<p>Sowing of regionally specific seed mixtures on former arable land is increasingly used to restore species-rich grasslands, but it often faces important obstacles in environmental conditions and colonisation from preserved surrounding grasslands. Long-term landscape scale studies, which explore the processes governing plant establishment from seed mixtures and later colonisation from the surrounding landscape are scarce. We studied the species and functional trait composition of 32 grasslands restored 1–11 years before the first sampling by sowing regional seed mixtures in the White Carpathian Mts (SE Czech Republic). We compared them with 23 well-preserved permanent grasslands in their surroundings. In each grassland we estimated plant species cover in three plots of 25 m<sup>2</sup>, in restored grasslands in 2009, 2014 and 2019, in permanent grasslands in 2009. The species composition of the restored grasslands converged towards the permanent grasslands due to expansion of dry grassland species and retreat of mesic grassland and weed species. The majority (60–71%) of the vegetation cover of restored grasslands was formed by sown species, while the species number was mainly determined by colonising unsown species (61–63%). The species number of restored grasslands remained lower than that in permanent grasslands. Functional trait composition (Community Weighted Mean) of the sown seed mixtures, permanent grasslands and restored grasslands overlapped in all three samplings. With increasing grassland age, species with resource-retaining traits of low specific leaf area and high leaf dry matter content, lower stature, higher seed mass, and lower capacity for clonal reproduction expanded. Functional trait diversity of the plots was mostly lower than expected by null model randomisations of community, which indicates strong environmental filtering. Comparison of newly colonising species and extinct species indicated that mainly species with traits similar to the rest of the community are able to colonise the grasslands successfully. Synthesis and applications. Sowing of regionally specific seed mixtures was successful and demonstrated to be a fast way of grassland restoration, particularly in terms of functional trait composition. The resulting species diversity depended on the colonisation processes, which are controlled by the functional composition of the local communities.</p>
Early meteorological observations in Almada (Portugal) for the period 1788-1813
<p>Daily and monthly meteorological observations recorded in Almada (Portugal) during the period 1788-1813.</p>
Rotation Period Predictions for Low-mass Stars with Kinematic Information from Gaia DR3
<pre><strong>DR3_kine_prot_pred.csv:</strong> 17.6 million predicted periods for all stars with Gaia DR3 RVs. This data should only be used to vet periods and not directly as period measurements. Works best for stars with GBP-GRP > 1.5 and rotation period > 20 days. Do not work for fast-rotating low-mass stars. Column descriptions see below </pre> <p><strong>source_id</strong>: Gaia DR3 source_id</p> <p><strong>ra</strong>: Gaia DR3 ra measurements</p> <p><strong>dec</strong>: Gaia DR3 dec measurements</p> <p><strong>parallax</strong>: Gaia DR3 parallax measurements</p> <p><strong>bp_rp</strong>: Gaia DR3 G<sub>BP</sub>-G<sub>RP</sub> measurements</p> <p><strong>phot_g_mean_mag</strong>: Gaia DR3 G mag</p> <p><strong>abs_G</strong>: absolute Gaia G magnitude derived from Gaia DR3 G mag and parallax</p> <p><strong>ruwe</strong>: Gaia DR3 ruwe measurements </p> <p><strong>Prot_pred</strong>: Predicted periods using Gaia DR3 parameters and kinematics</p> <p> </p> <p><strong>vet_ztf_lowmass.csv</strong>: 65k vetted ZTF period measurements for stars with G<sub>BP</sub>-G<sub>RP</sub> > 1.5. Column descriptions see below</p> <p><strong>source_id</strong>: Gaia DR3 source_id</p> <p><strong>ra</strong>: Gaia DR3 ra measurements</p> <p><strong>dec</strong>: Gaia DR3 dec measurements</p> <p><strong>parallax</strong>: Gaia DR3 parallax measurements</p> <p><strong>bp_rp</strong>: Gaia DR3 G<sub>BP</sub>-G<sub>RP</sub> measurements</p> <p><strong>gmag</strong>: Gaia DR3 G mag</p> <p><strong>abs_G</strong>: absolute Gaia G magnitude derived from Gaia DR3 G mag and parallax</p> <p><strong>rv</strong>: Gaia DR3 rv measurements</p> <p><strong>Prot</strong>: measured and vetted periods from ZTF </p>
Migration of mechanical perturbations estimated by seismic coda wave interferometry during the 2018 pre-eruptive period at Kīlauea volcano, Hawaii : Noise Cross-correlation Functions, Seismic catalog, and GNSS data
<p>ARCHIVE_NCFs_KILAUEA_2018.zip : Compress folder with (1) the daily noise cross-correlation functions (in MSEED format) of the station pairs used in the paper and (2) the one hour noise cross-correlation functions (in H5 format) of the station pairs used in the figure 9 of the paper.</p> <p>Code_Data_HVO.ipynb : Code to download the seismic data, available on IRIS, used in this paper.</p> <p>GPS_data_AHUP.zip : Compress folder with the daily GPS data of the station AHUP used in the paper [Year, Month, Day, Day_of_the_year, Second_of_the_day, East_comp(mm), North_comp(mm), Vertical_comp(mm), Sig_East_comp, Sig_North_comp, Sig_Vertical_comp].</p> <p>Radial_tilt_UWD.txt : Daily radial tilt measurement of the tiltmeter UWD [Year, Month, Day, Radial_tilt(µrad)].</p> <p>Seismic_stations_Kilauea.txt : Name code and location of the seismic stations used in the paper [Station_code, Longitude, Latitude].</p> <p>Seismicity_Catalog_Kilauea_2018_USGS.txt : Seismic catalog from USGS used in the paper [Date_Time, Latitude, Longitude, Depth, Magnitude].</p>
Leaf traits of understory woody species in the Congo Basin forests changed over a 60 years period
<p>Data collected in Yangambambi (DR Congo) and used to prepare the article accepted for publication in the journal Plant Ecology and Evolution. </p>
List of geomagnetic storms for the period September 2012 - July, 2019
<p>The following dataset includes the epoch times and corresponding Sym-H minima for the 144 geomagnetic storms identified between September 2012 and July 2019. </p>
Dataset: Periodic variation of mesoscale ultraviolet contrast at the cloud top of Venus
<p>Filename:<br> mean_A_283.txt : wavelength of 283 nm<br> mean_A_365.txt : wavelengths of 365 nm</p> <p>Description:<br> Empirical equigonal UV albedo of Venus as a function of the phase angle determined from Akatsuki UVI data.</p> <p>Format (text file): <br> 1st column: Phase angle (deg)<br> 2nd column: A:Mean albedo<br> 3rd column: SD:Standard deviation</p> <p> </p> <p>Filename:<br> period1_283nm.txt : Period 1, 283 nm<br> period1_365nm.txt : Period 1, 365 nm<br> period2_283nm.txt : Period 2, 283 nm<br> period2_365nm.txt : Period 2, 365 nm</p> <p>Description:<br> Time series of the standard deviation of mesoscale UV contrast and the mean brightness of Venus.</p> <p>Format (text file):<br> 1st column: Image file name<br> 2nd column: Elapsed time (h)<br> 3rd column: Phase angle (deg)<br> 4th column: Standard deviation (W/m2/str/m)<br> 5th column: Standard deviation in AM<br> 6th column: Standard deviation in PM<br> 7th column: Mean brightness (W/m2/str/m)<br> 8th column: Mean brightness in AM<br> 9th column: Mean brightness in PM</p> <p> </p> <p>Filename:<br> uvi_20160425_131340_283_l3b_v10.nc<br> uvi_20160425_151341_283_l3b_v10.nc<br> uvi_20160425_171339_283_l3b_v10.nc<br> uvi_20160506_101341_283_l3b_v10.nc<br> uvi_20160506_121340_283_l3b_v10.nc<br> uvi_20160506_141343_283_l3b_v10.nc<br> uvi_20160517_141339_283_l3b_v10.nc<br> uvi_20160517_161339_283_l3b_v10.nc</p> <p>Description:<br> 2.02-micrometer mapped data taken by the IR2 camera onboard Akatsuki in Level-3 netCDF format. The data have been corrected for the point-spread function, the flat-field pattern, and the detector temperature dependence by Sato et al. (2020, Icarus, 345, 113682, https://doi.org/10.1016/j.icarus.2020.113682).</p> <p>Format (binary file):<br> netCDF<br> The file names indicate the year, date and time of each observation.</p> <p> </p>
Permits issued in respect of South Africa's National Environmental Management: Biodiversity Act's Alien and Invasive Species Regulations over the period October 2014–December 2022
<p>Data based on records of permits issued by the South African Department of Forestry, Fisheries, and the Environment (DFFE) to conduct activities on listed invasive species restricted under the NEM:BA A&IS Regulations of 2014<br> This is based on the file <Copy of Official AIS Permit Register (31 Aug 2019).xlsx> with updates to 2020 based on the updates in the file <AIS Permit Register Updated to 21 January 2021.xlsx> and updates to Dec 2022 based on the file <AIS Permit register updated up to 31 Decenber 2022.xlsx><br> Compiled for the purposes of the reporting process "The Status of Biological Invasions and their Management in South Africa", see http://iasreport.sanbi.org.za/ for more details. Can access the latest report on Zenodo http://dx.doi.org/10.5281/zenodo.3947613 and the latest species list associated with the report via http://dx.doi.org/10.5281/zenodo.3947659<br> For details of how this was constructed see the relevant workflow in the status report process.<br> Where appropriate the rationale for issuing a permit is as per the wording of the regulations and lists of 2020 (see below for the full citation)<br> Each row represents a permit for a particular species for a particular activity. Permit numbers can cover multiple taxa<br> The original data-set has details of the applicant and their contact numbers, who the permit was handled by, and the method by and date on which the permit was sent to the permit holder, these have been redacted<br> Note there can be multiple permits issued to the same permit holder for the same species for the same purposes with the same start and end date<br> In cases where two permits were issued to the same applicant and one of which was for research, both were deemed for research even if it was not specified as such</p> <p>For enquiries contact: invasives@sanbi.org.za or IAS.report.SANBI@gmail.com</p> <p>Suggested citation (noting that in most cases it will be more appropriate to reference the Department responsible itself): SANBI (2023) Permits issued in respect of South Africa's National Environmental Management: Biodiversity Act's Alien and Invasive Species Regulations over the period October 2014 – December 2022. version 20230809. Zenodo. https://dx.doi.org/10.5281/zenodo.8229321</p>
Water loss, not overheating, limits the activity period of an endothermic Sonoran Desert bee
<ol> <li>Desert animals must manage the physiological stresses of heat and desiccation; evaporative heat loss mitigates overheating but exacerbates water stress. Small endothermic flying insects may be particularly vulnerable to overheating and water stress as a result of high surface area to volume ratios, but we lack quantitative understanding of the relative magnitude of these abiotic stressors in flying desert invertebrates, despite their ecological importance.</li> <li>During the hottest and driest weeks of the year, many thousands of males of the Sonoran Desert digger bee (<em>Centris</em> <em>caesalpiniae</em>) flew near-continuously at elevated thorax temperatures for hours at mating aggregation sites, while occasionally fighting other males and digging for females.</li> <li>To determine whether incapacitating high temperatures or water loss limited the activity period of male <em>C. caesalpiniae</em>, we assessed wet and dry body mass and water content through the activity period, crop volume and sugar content, microclimate selection, water loss rate and metabolic water production during flight, critical water content, and maximum critical temperature.</li> <li>Body masses and sizes of males declined through the morning and smaller bees had higher fractional water contents. Crop volume and sugar content did not vary through the day or with bee size.</li> <li>Maximum critical temperature during flight was 51°C, similar to those measured for other bees, and well above temperatures reached in the field, suggesting that avoidance of over-heating does not limit activity in this desert bee.</li> <li>The critical water content of <em>Centris</em> bees averaged 50%. Measures of net water loss rate indicated that males approached lethal water loss limits within four hours, suggesting that desiccation tolerance limits activity. Remarkably, male <em>C. caesalpiniae </em>were not observed to forage at floral or water sources during the activity period, and foraged over multiple days, suggesting selection to maintain reproductive success and that these males have a mechanism to rehydrate when not at the mating aggregation.</li> </ol>
Model output for "On the length and intensity of the West African Summer Monsoon during the Last interglacial Green Sahara Period"
<p>This dataset gives the model outputs from a pre-industrial (PI) and a last interglacial (LIG) simulation based on AWIESM-wiso. A more detailed description of the individual file is presented below:</p> <p>lig_isotope_daily.nc: climatological daily isotope composition in precipitation for LIG. The second level represents delta18O and the the third level for deltaD.</p> <p>pi_isotope_daily.nc: climatological daily isotope composition in precipitation for PI. The second level represents delta18O and the the third level for deltaD.</p> <p>lig_precip_daily.nc: climatological daily precipitation for LIG. </p> <p>pi_precip_daily.nc: climatological daily precipitation for PI. </p> <p>lig_temp2_daily.nc: climatological daily surface air temperature for LIG. </p> <p>pi_temp2_daily.nc: climatological daily surface air temperature for PI. </p> <p>lig_wind_composite.nc: composited LIG wind by using as the West African Summer Monsoon (WASM) onset as reference date (zonal wind: var131; meridional wind: var132; vertical wind: var133). </p> <p>pi_wind_composite.nc: composited PI wind by using as the West African Summer Monsoon (WASM) onset as reference date (zonal wind: var131; meridional wind: var132; vertical wind: var133). </p> <p> </p>
WRF-Chem output- concentrations for the two simulations: Business as Usual and COVID for the two periods, March-April and May
<p>The WRF-Chem model was utilized to calculate the changes in O3 chemistry during the COVID lockdown period. We ran two simulations: (1) Business As Usual (BAU) and (2) COVID for the lockdown (30 March to 12 April 2020) and relaxation (18- 25 to 30 May 2020) periods. </p> <p>Here, we provide modelled concentrations for several chemical and physical species for 30 March to 12 April (only weekdays) and 18 to 30 May (only weekdays) for both simulations, BAU and COVID, over the AMB area during the morning (6-8 UTC), afternoon (13-15 UTC) and evening (19-21 UTC) hours. </p> <p>We also provide the WRF-Chem output used to create the air parcel trajectories and the ozone concentrations from the Metropolitan Area of Barcelona to the Pyrenees. </p>
Exploring the ENSO Modulation of the QBO Periods with GISS E2.2 Models
<p>These datasets are used in Zhou et al. (2023): Exploring the ENSO Modulation of the QBO Periods with GISS E2.2 Models.</p>
The Observed Disdrometer Heavy Rainfall Period Datasets in East China during the Meiyu Season
<p>The attached file includes all the 1757 Parsivel disdrometer heavy rainfall periods (HRPs) in East China during the 2019-2022 Meiyu season. The files are the XXX.mat format and can be directly opened with MATLAB.</p>
Collocated model and observation datasets for the validation of the Copernicus Mediterranean Sea Waves Analysis and Forecast for the period 2018-2020.
<p>The collocated values are used for skill evaluation of the Mediterranean Sea Waves Analysis and Forecast system for a three-year-long period (Korres et al., 2022). The list of datasets includes:</p> <ol> <li>The collocated model (analysis) – buoy values for significant wave height Hs (Insitu_Hs.mat)</li> <li>The collocated model (analysis) – buoy values for spectral moments (0,2) wave period Tm (Insitu_Tm.mat)</li> <li>The collocated model (first – guess) – satellite values for significant wave height Hs (Satellite_Hs.mat)</li> <li>The collocated model – satellite values for wind speed U10 (Satellite_U10.mat)</li> </ol> <p>Each .mat file contains a header for the variables included. Collocations can be used to estimate standard quality metrics (e.g. scatter index, bias, root-mean-squared-difference). Procedures to produce these model-observation collocated datasets and determine the overall skill assessment are described in detail in Ravdas et al. (2018) and Oikonomou et al. (2022). The buoy (in-situ) measurements are obtained from the product INSITU_GLO_WAV_DISCRETE_MY_013_045 (EU Copernicus Marine Service Product, 2022a), and associated variables contain a quality flag (“time_qc”, “position_qc”, “buoy_Hs_qc”, “buoy_Tm_qc”) (de Alfonso et al., 2022a,b). In addition, the model first-guess significant wave height and the wind speed forcing (Hersbach et al., 2023) are collocated with available satellite observations (EU Copernicus Marine Service Product, 2022b) over the entire model domain.</p> <p>References</p> <p>de Alfonso, M., Manzano, F., and Gallardo, A. (2022a): EU Copernicus Marine Service Quality Information Document for the In Situ TAC Product, INSITU_GLO_WAV_DISCRETE_MY_013_045, Issue 5.0, Mercator Ocean International, <a href="https://catalogue.marine.copernicus.eu/documents/QUID/CMEMS-INS-QUID-013-045.pdf">https://catalogue.marine.copernicus.eu/documents/QUID/CMEMS-INS-QUID-013-045.pdf</a></p> <p>de Alfonso, M., Manzano, F., Gallardo, A., and In Situ TAC (2022b): EU Copernicus Marine Service Product User Manual for Multi-Year WAVE In Situ Product, INSITU_GLO_WAV_DISCRETE_MY_013_045, Issue 2.0, Mercator Ocean International, <a href="https://catalogue.marine.copernicus.eu/documents/PUM/CMEMS-INS-PUM-013-045.pdf">https://catalogue.marine.copernicus.eu/documents/PUM/CMEMS-INS-PUM-013-045.pdf</a></p> <p>EU Copernicus Marine Service Product (2022a): Multi-Year WAVE In Situ Product, Mercator Ocean International, [dataset], <a href="https://doi.org/10.17882/70345">https://doi.org/10.17882/70345</a></p> <p>EU Copernicus Marine Service Product (2022b): Global Ocean L 3 Significant Wave Height From Reprocessed Satellite Measurements, Mercator Ocean International, [dataset], <a href="https://doi.org/10.48670/moi-00176">https://doi.org/10.48670/moi-00176</a></p> <p>Hersbach, H., Bell, B., Berrisford, P., Biavati, G., Horányi, A., Muñoz Sabater, J., Nicolas, J., Peubey, C., Radu, R., Rozum, I., Schepers, D., Simmons, A., Soci, C., Dee, D., Thépaut, J-N. (2023): ERA5 hourly data on single levels from 1940 to present. Copernicus Climate Change Service (C3S) Climate Data Store (CDS), DOI: 10.24381/cds.adbb2d47 (Accessed on 26-09-2023)</p> <p>Korres, G., Oikonomou, C., Denaxa, D., & Sotiropoulou, M. (2022): Mediterranean Sea Waves Analysis and Forecast (CMEMS MED-Waves, MEDWAΜ4 system) (Version 1) [Data set]. Copernicus Monitoring Environment Marine Service (CMEMS). <a href="https://doi.org/10.25423/CMCC/MEDSEA_ANALYSISFORECAST_WAV_006_017_MEDWAM4">https://doi.org/10.25423/CMCC/MEDSEA_ANALYSISFORECAST_WAV_006_017_MEDWAM4</a></p> <p>Oikonomou, C., Denaxa D., and Korres, G. (2022): EU Copernicus Marine Service Quality Information Document for the Mediterranean Sea Waves Reanalysis, MEDSEA_ANALYSISFORECAST_WAV_006_017, Issue 2.2, Mercator Ocean International, <a href="https://catalogue.marine.copernicus.eu/documents/QUID/CMEMS-MED-QUID-006-017.pdf">https://catalogue.marine.copernicus.eu/documents/QUID/CMEMS-MED-QUID-006-017.pdf</a>.</p> <p>Ravdas, M., Zacharioudaki, A., and Korres, G. (2018): Implementation and validation of a new operational wave forecasting system of the Mediterranean Monitoring and Forecasting Centre in the framework of the Copernicus Marine Environment Monitoring Service, Nat. Hazards Earth Syst. Sci., 18, 2675–2695, <a href="https://doi.org/10.5194/nhess-18-2675-2018">https://doi.org/10.5194/nhess-18-2675-2018</a></p> <p> </p>
Daily 500 hPa geopotential height from ERA5 for the period 1940-2022 for the North Atlantic domain - 2 degree resolution
<p>Data downloaded from the Copernicus Data Store from the `reanalysis-era5-pressure-levels` dataset. Data converted from hourly to daily and regridded using xarray. </p>
Figure 2 in Protandrous Arrival in a Population of the Periodical Cicada Magicicada septendecim (Linnaeus) (Hemiptera: Cicadidae) in Montgomery County, Maryland
Figure 2. Magicicada septendecim: newly eclosed teneral. (Maryland, Michael J. Raupp, 16 May 2004)
The town of Fukagawa in the Edo period
Nagaya well and others It is a shared space for Nagaya residents with a well, a communal toilet, a garbage collection, and Inari. Permanent exhibition "The town of Fukagawa in the Edo period" The Fukagawa Edo Museum is a "scenery reproduction, life reproduction exhibition" that recreates the townscape of Fukagawa Saga Town around the end of the Edo period and the Tenpo era. [Fukagawa Edo Museum](https://www.kcf.or.jp/fukagawa/), Koto Ward 1-3-28 Shirakawa, Koto-ku, Tokyo, 135-0021 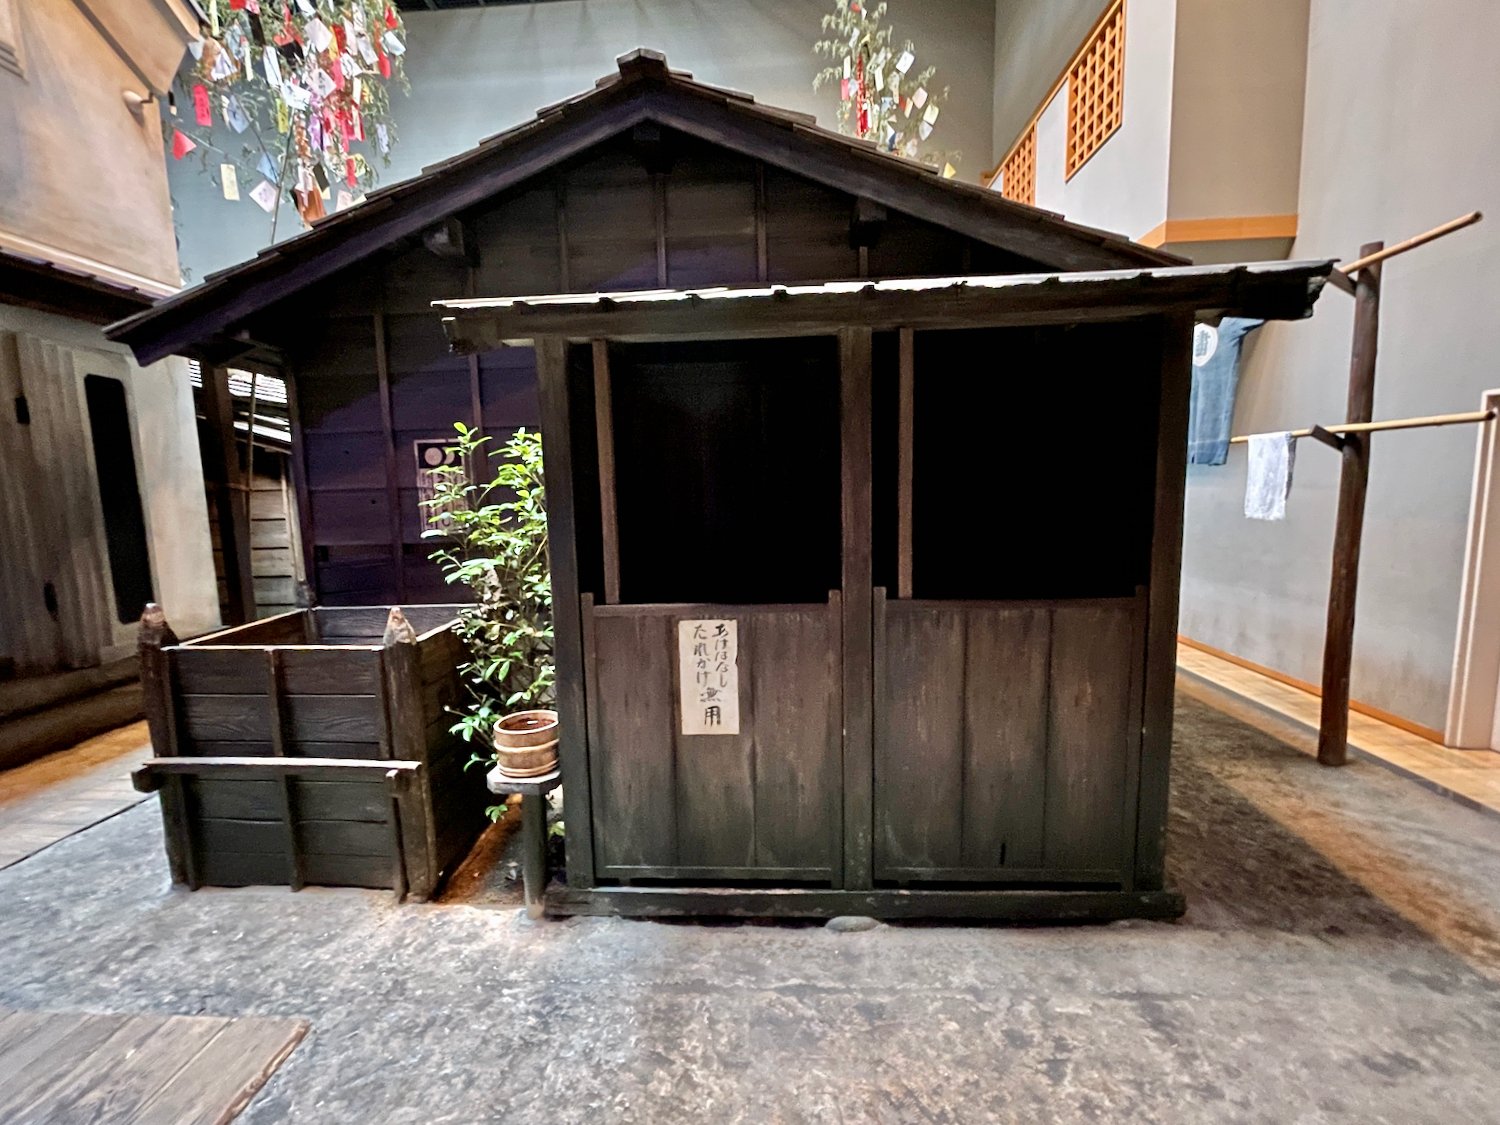 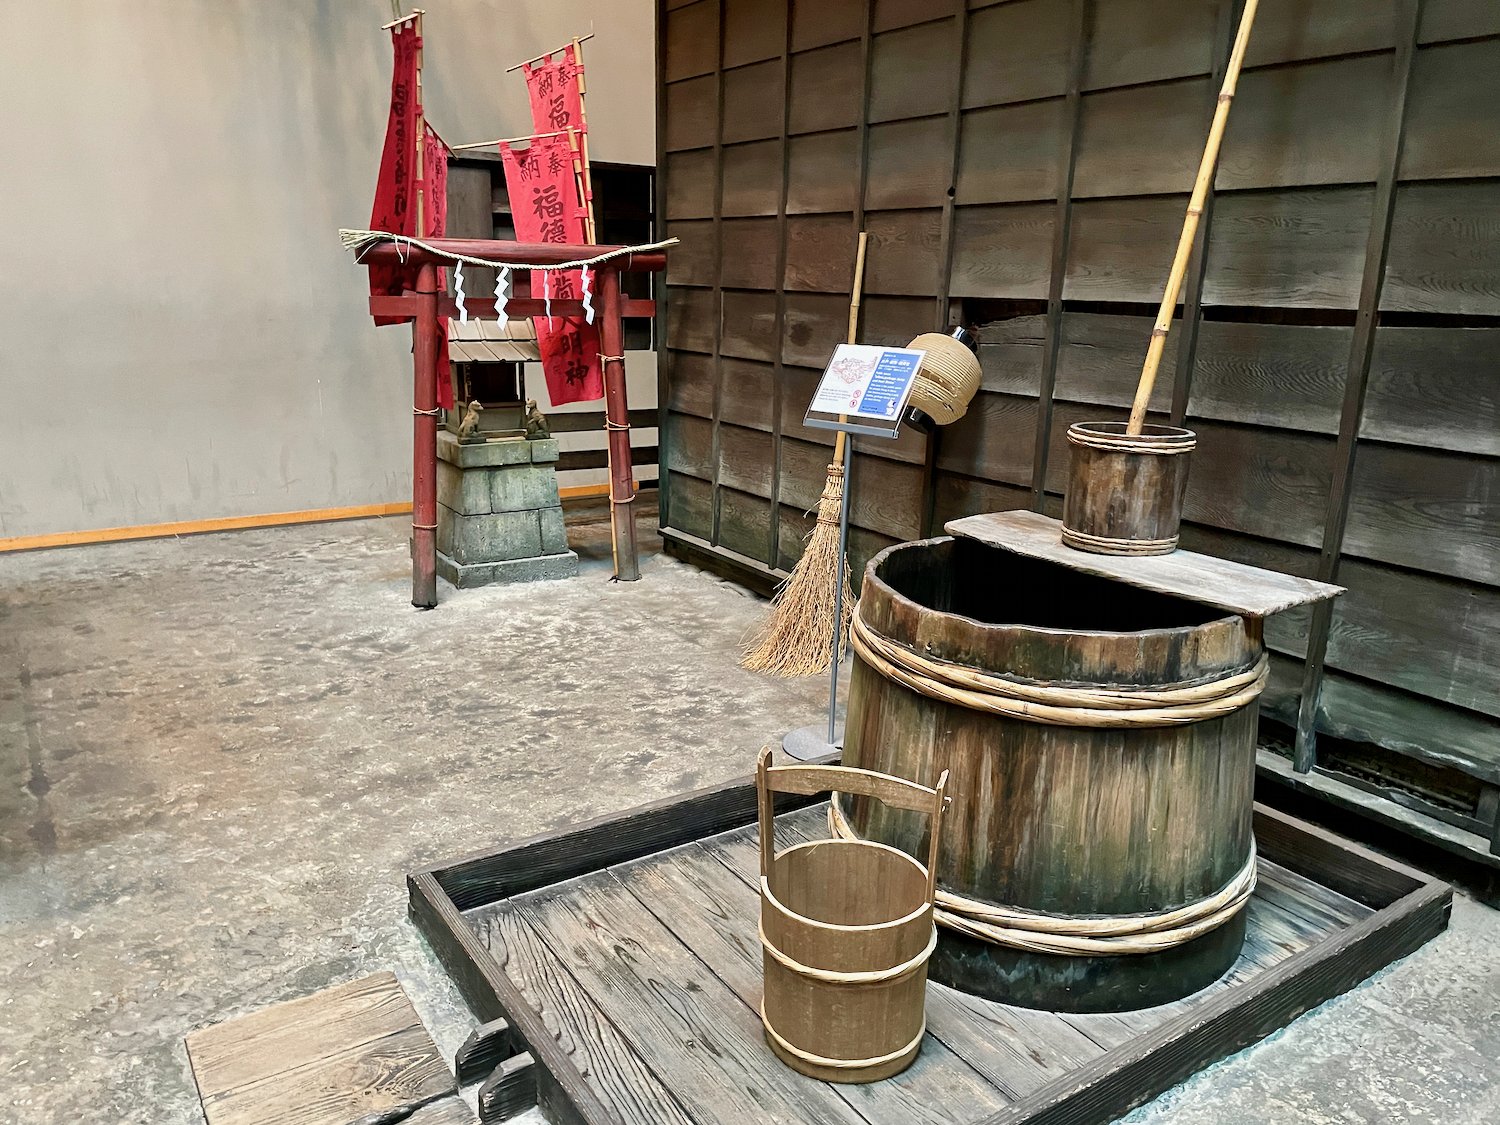 Source: Objaverse 1.0 / Sketchfab
Figure 5 in Fishing at Qal'at al-Bahrain, archipelago of Bahrain, from the Early Dilmun (2200 BC) to the Middle Islamic period (13-16th centuries AD)
Figure 5. - Today, jaliboots are fishing boats (Bahrain National Museum, photo: J. Vorenger).
Figure 1 in Fishing at Qal'at al-Bahrain, archipelago of Bahrain, from the Early Dilmun (2200 BC) to the Middle Islamic period (13-16th centuries AD)
Figure 1. - Aerial view of Qal'at alBahrain (photo: French archeological mission).
ScienceDex guides
Understand access before you commit
These curated guides explain access requirements, typical timelines, costs, and reuse considerations for widely used research datasets.
Allen Brain Atlas
Allen Brain Atlas is an Allen Institute collection of brain map atlases, datasets, APIs, and analysis tools covering mouse, human, and non-human primate brain resources.
Annotated Behaviour and Observability Dataset (ABODe)
ABODe is a University of Edinburgh DataShare dataset for behavior classification in group-housed mice using home-cage video, identities, bounding boxes, ground-plate positions, and annotator labels.
DANDI Archive for NWB datasets
DANDI is a BRAIN Initiative archive for publishing and sharing neurophysiology data, including electrophysiology, optophysiology, and behavioral data packaged as NWB and related standards.
International Brain Laboratory public data
The International Brain Laboratory public data releases expose standardized mouse decision-making experiments, including Neuropixels recordings, widefield calcium imaging, behavior, and session metadata accessed through the ONE API.
OpenNeuro
OpenNeuro is a free, open platform for sharing neuroimaging datasets, with public search, dataset pages, and download paths for web, S3, DataLad, and the OpenNeuro CLI.