
Find research datasets worth reusing
Search datasets from major research repositories and use ShareScore to quickly assess how well each record supports discovery, access, and reuse.
1,092
datasets available to search
ShareScore release 0.9.0
Dataset results
1,092 results for “The Sun”
Fig. 1 in Exploring potential range connectivity of sun bear (Carnivora: Ursidae: Ursinae)
Fig. 1. Density plots of Human Influence Index values within areas classified as habitat and non-habitat within sun bear range. Human Influence Index values (Sanderson et al., 2002) were calculated to 30,000 random points generated equally within areas of non-habitat and habitat. Human Influence Index values were on average 13.8 points higher in areas classified as non-habitat (t = –95.2, df = 29658, p <0.001, x – within non-habitat = 36.7, SD = 13.1, x – within habitat = 23, SD = 11.8) supporting our assumption that habitat is different from non-habitat.
Fig. 3 in Exploring potential range connectivity of sun bear (Carnivora: Ursidae: Ursinae)
Fig. 3. Sun bear landscape fragmentation and connectivity in Southeast Asia, India and Bangladesh. A) Core and sub-optimal contiguous range is assumed to positively impact bear movement (i.e., connectivity), although dependent on associated levels of human influence and roads. Visual analysis identified seven potential subpopulations of sun bears; i) northern Mainland, ii) Central Myanmar, iii) Central SE Asia, iv) South-central SE Asia, v) Thai-Malay peninsula, vi) Sumatra, vii) Borneo (divided by dashed lines). Within these potential subpopulations there were many 'At Risk' areas where sun bears may be vulnerable to becoming isolated due to potential barriers to movement including habitat fragmentation, high human influence and roads (identified by red ovals and numbers 1–16 correspond with the IDs listed in Table 2). B) High Human Influence and road network are assumed to be significant barriers to bear movement across the sun bear landscape.
MicroCT scans of sun and shade grown leaves of Cabernet Sauvignon and Blaufränkisch grapevine (Vitis vinifera L.) cultivars
<p>Image data set of sun and shade-grown leaves of Cabernet Sauvignon (CS) and Blaufränkisch (BF) grapevine (Vitis vinifera L.) cultivars.</p> <p>When using this dataset, please cite:</p> <blockquote> <p>Théroux-Rancourt G, Herrera C, Voggeneder K, Luijken N, Nocker L, Savi T, Scheffknecht S, Schneck M, Tholen D. (accepted) Analyzing anatomy over three dimensions unpacks the differences in mesophyll diffusive area between sun and shade Vitis vinifera leaves. AoB Plants</p> </blockquote> <p> </p> <p><strong>Data acquisition methodology</strong></p> <p>Plants were brought to the TOMCAT tomographic beamline of the Swiss Light Source at the Paul Scherrer Institute (Villigen, Switzerland) in pots (Cabernet Sauvignon (CS)) or as cut shoots with the cut end placed in water (Blaufränkisch (BF)). Before scanning, a leaf was cut from the stem and a thin strip of ~1.5 mm width and 1.5 cm length was cut in between apparent higher-order veins, immediately wrapped in polyimide tape and inserted into a styrofoam block glued with wax onto a holder. Three (CS) or two (BF) strips were cut at different locations on the leaf surface to ensure within-leaf replications and to get better leaf-level averages. The strip was immediately scanned by imaging 1801 projections of 100 ms under a beam energy of 21 keV and magnified using a 40x (CS) or 20x (BF) objective, yielding respective final voxel sizes of 0.1625 µm (field of view: ~416x416x312 µm) and 0.325 µm (field of view: ~832x832x624 µm). Scanned projections were reconstructed to cross-sectional view using both absorption (gridrec; Marone <em>et al.</em> 2012) and phase contrast enhancement (Paganin <em>et al.</em> 2002) reconstructions.</p> <p><br> <br> <strong>Dataset description</strong></p> <p>After aligning the stacks to be parallel to the image edges using ImageJ (Schneider <em>et al.</em> 2012), at least nine slices were hand labeled using a graphics pen display tablet to precisely segment the background, the epidermis, and the vasculature. The mesophyll cells and the intercellular airspace were segmented by thresholding each absorption and phase contrast scan to maximize airspace volume (background) and taking care to avoid false segmentation within the cells (i.e. false segmentation of airspace). The hand-labeled slices were then used to automatically segment the whole stack using a Python-based random-forest machine learning approach (Théroux-Rancourt, Jenkins, <em>et al.</em> 2020).</p> <p> </p> <p><strong>File naming convention</strong></p> <p>For all stacks, files start with:<br> <em>Cultivar_Treatment_Plantn_leaf_N_</em></p> <ul> <li>Cultivar: <em>CS</em> for Cabernet Sauvignon, <em>BF</em> for Blaufränkisch</li> <li>Treatment: <em>Sun</em> for plants grown under high light, <em>Shade</em> for plants grown under low light</li> <li>Plantn: Plant number; 1-6 for CS, 1-5 for BF</li> <li>leaf: Leaf number; 1-4</li> </ul> <p><em>N</em> specifies the type of stack:</p> <ul> <li><em>GRID</em> (gridrec reconstruction)</li> <li><em>PAGANIN</em> (phase contrast enhancement reconstruction)</li> <li><em>labelled-stack</em> (hand labeled slices / ground truth; stacks have been hand labeled in cross-sectional view.)</li> <li><em>SEGMENTED</em> (automatically segmented stack using random-forest machine learning approach)</li> <li><em>STOMATAL_REGIONS_BBOX_CROPPED</em> (Stack with individually segmented stomatal vaporsheds, i.e. airspace closest to a stoma. The stack has been cropped in paradermal view around the stomata closest to the stack's edges, i.e. a bounding box (BBOX) with stomatal vaporsheds fully enclosed).</li> </ul> <p>All stacks are provided as 8-bit grayscale TIF files. Stacks have been hand labeled in cross-sectional view.</p> <p> </p> <p><strong>Plant material and growth conditions </strong></p> <p>The experiment was carried out over two consecutive years, in 2018 and 2019, at the facilities of BOKU UFT (Tulln, Austria). In the first year, rooted grafts of <em>Vitis vinifera </em>‘Cabernet Sauvignon’ (clone 191E) on 101-14 rootstock (hereafter named CS) were acquired from a local nursery (<em>Reben Iby</em>, Neckenmarkt, Austria). In the second year, rooted grafts of <em>Vitis vinifera </em>‘Blaufränkisch’ (clone 13-3 GM) on 5 BB rootstock (hereafter named BF) were acquired from the same nursery. Blaufränkisch is known to have originated from Lower Styria (present day Styria, Slovenia, Maul <em>et al. </em>2016) and to be genetically different from Cabernet Sauvignon (Magris <em>et al. </em>2021), which originated in the Bordeaux region in France.</p> <p>The rooted grafts were planted in 7-L pots and allowed to grow in a glasshouse without any environmental control. For CS, nutrient-rich, sieved vineyard soil mixed with perlite (3:1 ratio) was used, while for BF pots were filled with commercial pot substrate containing slow release fertilizer (10 g pot-1, 15-5-20 NPK “Entec vino”). Pots were watered to pot capacity automatically every day. Clones were planted June 1 and April 1 in the first and second year, respectively. When all the plants had at least three mature leaves on one shoot, plants were pruned so that only one dominant shoot remained. To ensure that only leaves fully developed under different light conditions were used for further analyses, the last developing leaf below the tip was marked before moving half of the plants to the shaded environment (on June 29, 2018 for CS and on April 18, 2019 for BF). For the shade treatment, a tent of about 2 m (height) x 1.5 m (width) x 1.5 m (depth) was made from black polypropylene cloth (HaGa-Welt GmbH & Co. KG, Elze, Germany), resulting in a 60% reduction in photosynthetic photon flux density (PPFD). A spectrometer (FLAME-S-VIS- ES, Ocean Optics Inc. Largo, USA) was used to confirm that under both light conditions, relative differences in the contribution of red, green blue and far-red light to the total PPFD were below 5% (i.e. spectrally neutral shade).</p> <p>During the week before synchrotron microCT scanning (last week of August in 2018 and first week of September in 2019), one mature leaf per plant was selected at least three leaves above the previously mentioned mark indicating the last developing leaf at the start of the shade treatment. The measured leaves were estimated to be about one month old, resulting in an average daily light integral (DLI) of 30 (CS sun), 12 (CS shade), 24 (BF sun), and 10 (BF shade) mol m<sup>-2</sup> day<sup>-1</sup>. These estimates were computed using solar radiation measured at a weather station a few meters from the glasshouse, and using PPFD values measured inside the glasshouse. Average daily PPFD was below 700 μmol m<sup>-2</sup> s<sup>-1</sup> under full light, with maximum recorded values at leaf level of ~1200 μmol m<sup>-2</sup> s<sup>-1</sup> under full light and ~500 μmol m<sup>-2 </sup>s<sup>-1</sup> under shade, i.e. ~60% reduction.</p> <p> </p> <p><strong>References</strong></p> <p><strong>Marone F, Stampanoni M</strong>. <strong>2012</strong>. Regridding reconstruction algorithm for real-time tomo- graphic imaging. <em>J. Synchrotron Radiat. </em><strong>19</strong>: 1029–1037.</p> <p><strong>Paganin D, Mayo SC, Gureyev TE, Miller PR, Wilkins SW</strong>. <strong>2002</strong>. Simultaneous phase and amplitude extraction from a single defocused image of a homogeneous object. <em>J. Microsc. </em><strong>206</strong>: 33–40.</p> <p><strong>Schneider CA, Rasband WS, Eliceiri KW</strong>. <strong>2012</strong>. NIH Image to ImageJ: 25 years of image analysis. <em>Nat. Methods </em><strong>9</strong>: 671–675.</p> <p><strong>Théroux-Rancourt G, Jenkins MR, Brodersen CR, McElrone A, Forrestel EJ, Earles JM</strong>. <strong>2020</strong>. Digitally deconstructing leaves in 3D using X-ray microcomputed tomography and machine learning. <em>Appl. Plant Sci. </em><strong>8</strong>: e11380.</p>
After the sun: A nanoscale comparison of the surface chemical composition of UV and soil weathered plastics data
<p>The present folder contains the raw data as well as the R script used in the following publication : <em>After the sun: A nanoscale comparison of the surface chemical composition of UV and soil weathered plastics. </em>To extract the data:</p> <p> </p> <ol> <li>Download the .zip file and extract all the files it contains in a folder, without changing the hierarchy</li> <li>Open the Rproject by double-clicking on it</li> <li>Run the script and explore the outputs in the <em>Script_01_output </em>folder</li> </ol> <p>The data extracted from the HDF5 files before any processing are saved as .csv files in the <em>CSV </em>folder.</p>
Fulldome video about the apparent motions of the Sun and stars
<p>Fulldome video that illustrates the apparent motions of the Sun and the stars: the daily motion of the stars, the daily motion of the Sun, and the annual motion of the Sun.</p> <p>Produced in collaboration with CeSDA (Italy) and NOESIS (Greece)</p>
"The sound comes from a meadow in the Sierra Nevada Mountains in California. The meadow is at an elevation of 2400 meters near a mountain named Olancha Peak, which is 3700 meters in altitude. Ihave a group of friends with which Ibackpack (trek) into the mountains. Our goal was to spend some time in the mountains and hike to the top of Olancha Peak (…) By the time we reached the meadow, we were in a forest and there was still snow on the ground in some places. We took the trip in June of 2006. The Sierra Nevada Mountains are a large mountain range. Much of the range is protected by national parks or preserved areas we call 'wilderness areas' (…) Ihave been backpacking for nearly 40 years and Iwill hopefully continue with this challenging activity for 40 years more! Many of my friends are much younger than Iam and it gives me much satisfaction to be able to have as much or more stamina for this activity than they have! When we are on these trips, we hike up peaks, catch fish, drink some whiskey around campfires and enjoy our time in the beautiful solitude. My memories of this trip were of the steep, hot hike from the desert to the cool meadow; the overall beauty of the nature, the absolute solitude of our campsite near the meadow; the strenuous hike to the top of Olancha Peak; the camaraderie of my friends; and, of course the sound of the frogs in the meadow. The frog sounds were astounding to me and Iwould listen in awe of the creature's instinctual desire to reproduce and continue the existence of their kind. Surely there were different species in the meadow for some of the frog sounds were different than others. The sounds only occurred after the Sun went down for the evening. Istood next to the creek in the meadow and recorded the sounds using my digital camera." [Peter/plentz1960]16 in Collecting Sounds. Online Sharing of Field Recordings as Cultural Practice
"The sound comes from a meadow in the Sierra Nevada Mountains in California. The meadow is at an elevation of 2400 meters near a mountain named Olancha Peak, which is 3700 meters in altitude. Ihave a group of friends with which Ibackpack (trek) into the mountains. Our goal was to spend some time in the mountains and hike to the top of Olancha Peak (…) By the time we reached the meadow, we were in a forest and there was still snow on the ground in some places. We took the trip in June of 2006. The Sierra Nevada Mountains are a large mountain range. Much of the range is protected by national parks or preserved areas we call 'wilderness areas' (…) Ihave been backpacking for nearly 40 years and Iwill hopefully continue with this challenging activity for 40 years more! Many of my friends are much younger than Iam and it gives me much satisfaction to be able to have as much or more stamina for this activity than they have! When we are on these trips, we hike up peaks, catch fish, drink some whiskey around campfires and enjoy our time in the beautiful solitude. My memories of this trip were of the steep, hot hike from the desert to the cool meadow; the overall beauty of the nature, the absolute solitude of our campsite near the meadow; the strenuous hike to the top of Olancha Peak; the camaraderie of my friends; and, of course the sound of the frogs in the meadow. The frog sounds were astounding to me and Iwould listen in awe of the creature's instinctual desire to reproduce and continue the existence of their kind. Surely there were different species in the meadow for some of the frog sounds were different than others. The sounds only occurred after the Sun went down for the evening. Istood next to the creek in the meadow and recorded the sounds using my digital camera." [Peter/plentz1960]16
Shaped by the sun: the effect of exposure to sunlight on the evolution of spider bodies
Open the record for dataset details and reuse information.
Sun compass neurons are tuned to migratory orientation in monarch butterflies
Open the record for dataset details and reuse information.
Effects of environmental translocation and host characteristics on skin microbiomes of sun-basking fish
Open the record for dataset details and reuse information.
Sun exposure as a key factor influencing saproxylic beetle communities
Open the record for dataset details and reuse information.
Interactive effects of sun-shade and dry-wet treatments on seedlings of four beech (Fagus sylvatica L.) provenances
<p>We tested whether seedlings of four beech provenances, from contrasting edaphoclimatic environments, expressed differences in trait responses to imposed water stress under sun and shade treatments. Populations from the southern range margin were expected to display greater water-stress tolerance and core populations faster growth rates in the absence of abiotic limitations.</p> <p>Seedlings germinated under controlled conditions and were grown under controlled light-x-watering treatment combinations comprising shade/sun (main plot factor) and well-watered/water-limited (split-plot factor) groups. Beech seedlings remained under the experimental conditions from May through to September.</p> <p>Multiple sampling of growth (height, branching, number of leaves, leaf length, and root collar diameter), and leaves traits reflecting photosynthetic productivity and stress tolerance were made during the spring and summer. Leaf level gas exchange was measured by IRGA, leaf pigmentation by multiple optical sensors, leaf water potential with a pressure chamber, as well as plants and leaf morphological traits at the end of the experiment.</p> <p>Methods and Results are described in detail in the manuscript: Title: <strong>Seedlings from marginal and core populations of European beech (<em>Fagus sylvatica </em>L.) respond differently to imposed drought and shade. </strong>Authors: Fang Wang, David Israel, José-Alberto Ramírez-Valiente, David Sánchez-Gómez, Ismael Aranda, Pedro J Aphalo, T Matthew Robson.</p> <p>Files added are:"OverallData.xlsx" are the raw leaf level data collected in the experiment for the traits recorded, arranged in spreadsheets according to measurement type. Sheets are: "SoilMoistureRData", "PARData", "GasExchangeFigureData", "LeafObsData", "GrowthData", "LeafTraitsFigureData".</p> <p>"SummaryData.xlsx" are the individual replicate plot level summary data (calculated from the OverallData in R) for use in statistical analyses. Sheets are: "comparison", "GasExchangeSummary", "LeafTraitsSummary".</p> <p>"FMIradiation1hrData.xlsx" and "FMIradiation10minData.xlsx" Downloaded FMI irradiance data for the period of the experiment from Kumpula Meteorological Station (at 1hr and at 10 min interval), organised and arranged in spreadsheets: FMIradiation....xlsx files</p> <p>"Statistical Tables.docx" are summaries of the statistical tables calculated from the experimental data.</p> <p>"Statistics.zip" contains individual excel files showing the statistical analyses, least squared means, and pairwise comparisons for each analysed trait, plus the statistical code used to run these analyses. One file put trait- these files are summarised in "Statistical Tables.docx"</p> <p>"Plasticity Index.docx" show the results of calculated plasticity index for each of the traits measured, and details of how this calculation was performed.</p>
Data from: Optimizing enrichment of deadwood for biodiversity by varying sun exposure and tree species: an experimental approach
<p>1. The enrichment of deadwood is essential for the conservation of saproxylic biodiversity in managed forests. However, existing strategies focus on a cost-intensive increase of deadwood amount, while largely neglecting increasing deadwood diversity.</p> <p>2. Deadwood objects, i.e. logs and branches, from six tree species were experimentally sun-exposed, canopy-shaded, and artificially shaded for four years, after which the alpha-, beta-, and gamma-diversity of saproxylic beetles, wood-inhabiting fungi, and spiders were analyzed. Analyses of beta-diversity included the spatial distance between exposed deadwood objects. A random-drawing procedure was used to identify the combination of tree species and sun exposure that yielded the highest gamma-diversity at a minimum of exposed deadwood amount.</p> <p>3. In sun-exposed plots, species numbers in logs were higher than in shaded plots for all taxa, while in branches we observed the opposite for saproxylic beetles. Tree species affected the species numbers only of saproxylic beetles and wood-inhabiting fungi. The beta-diversity of saproxylic beetles and wood-inhabiting-fungi among logs was influenced by sun exposure and tree species, but beta-diversity of spiders by sun exposure only. For all saproxylic taxa recorded in logs, differences between communities increased with increasing spatial distance.</p> <p>4. A combination of canopy-shaded <i>Carpinus</i> logs and sun-exposed <i>Populus</i> logs resulted in the highest species numbers of all investigated saproxylic taxa among all possible combinations of tree species and sun-exposure treatments.</p> <p>5. <i>Synthesis and applications</i>. We recommend incorporating the enrichment of different tree species and particularly the variation in sun exposure into existing strategies of deadwood enrichment. Based on the results of our study, we suggest to combine logs of softwood broadleaf tree species (e.g. <i>Carpinus, Populus</i>), hardwood broadleaf tree species (e.g. <i>Quercus</i>) and coniferous tree species (e.g. <i>Pinus</i>) under different conditions of sun exposure and distribute them spatially in a landscape to maximize the beneficial effects on overall diversity.</p>
Sun Hat Model
This was my first photogrammetry attempt using VSFM, PMVS/CMVS and MeshLab. I used 65 photos taken with manual settings on a Rebel T2i. I followed the following tutorial: http://wedidstuff.heavyimage.com/index.php/2013/07/12/open-source-photogrammetry-workflow/ Source: Objaverse 1.0 / Sketchfab
Sun watch, Beauvais
 Antique sun watch, site at Beauvais, in the gardens of the [episcopal palace, near the Saint Peter's cathedral, Musée départemental de l'Oise](https://en.wikipedia.org/wiki/Mus%C3%A9e_d%C3%A9partemental_de_l%27Oise)  Source: Objaverse 1.0 / Sketchfab
Supervision - Journey To The West - Sun Wukong
Supervision - Journey to the West - Sun Wu Kong Sun Wukong - Monkey Source: Objaverse 1.0 / Sketchfab
The Gate of the Sun
<b>Here is a relic from ancient empire of Tiwanaku; the <a href="https://en.wikipedia.org/wiki/Gate_of_the_Sun"> Gate of the Sun.</a> </b> <p>[1] The Gateway construction can be represented mathematically by golden number; and relic itself was probably used as Sun and Venus calendar.</p> <p>That is a beautiful way how civilization is connected to the nature.</p> <p>Man has tried to understand nature and represent it in mathematical ways since ancient times. Looking back to the past, we found that ancient civilizations understood the beauty of nature, and that they expressed it by numbers. Its megalithic giant's constructions and its iconography are still at the Bolivian plateau.</p> <p><i>[1] Conference: 2017 International Conference on Applied Mathematics, Modelling and Statistics Application (AMMSA 2017) </i></p> [](https://ko-fi.com/F1F1DN4RR) Source: Objaverse 1.0 / Sketchfab
Copy of Aztec sun stone, Museo Nacioanal.
[1935.41.0016](https://collections.smvk.se/carlotta-em/web/object/1285703), lerplatta, kopia Lerplatta. Avbildning av "kalenderstenen" i Museo Nacioanal. Nedtill en utskjutande klack samt utrustad med ett hål för upphängning. The Aztec sun stone (Spanish: Piedra del Sol) is a late post-classic Mexica sculpture housed in the National Anthropology Museum in Mexico City, and is perhaps the most famous work of Mexica sculpture. It measures 358 centimetres (141 in) in diameter and 98 centimetres (39 in) thick, and weighs 24,590 kg (54,210 lb). Shortly after the Spanish conquest, the monolithic sculpture was buried in the Zócalo, the main square of Mexico City. It was rediscovered on 17 December 1790 during repairs on the Mexico City Cathedral. Following its rediscovery, the sun stone was mounted on an exterior wall of the cathedral, where it remained until 1885. 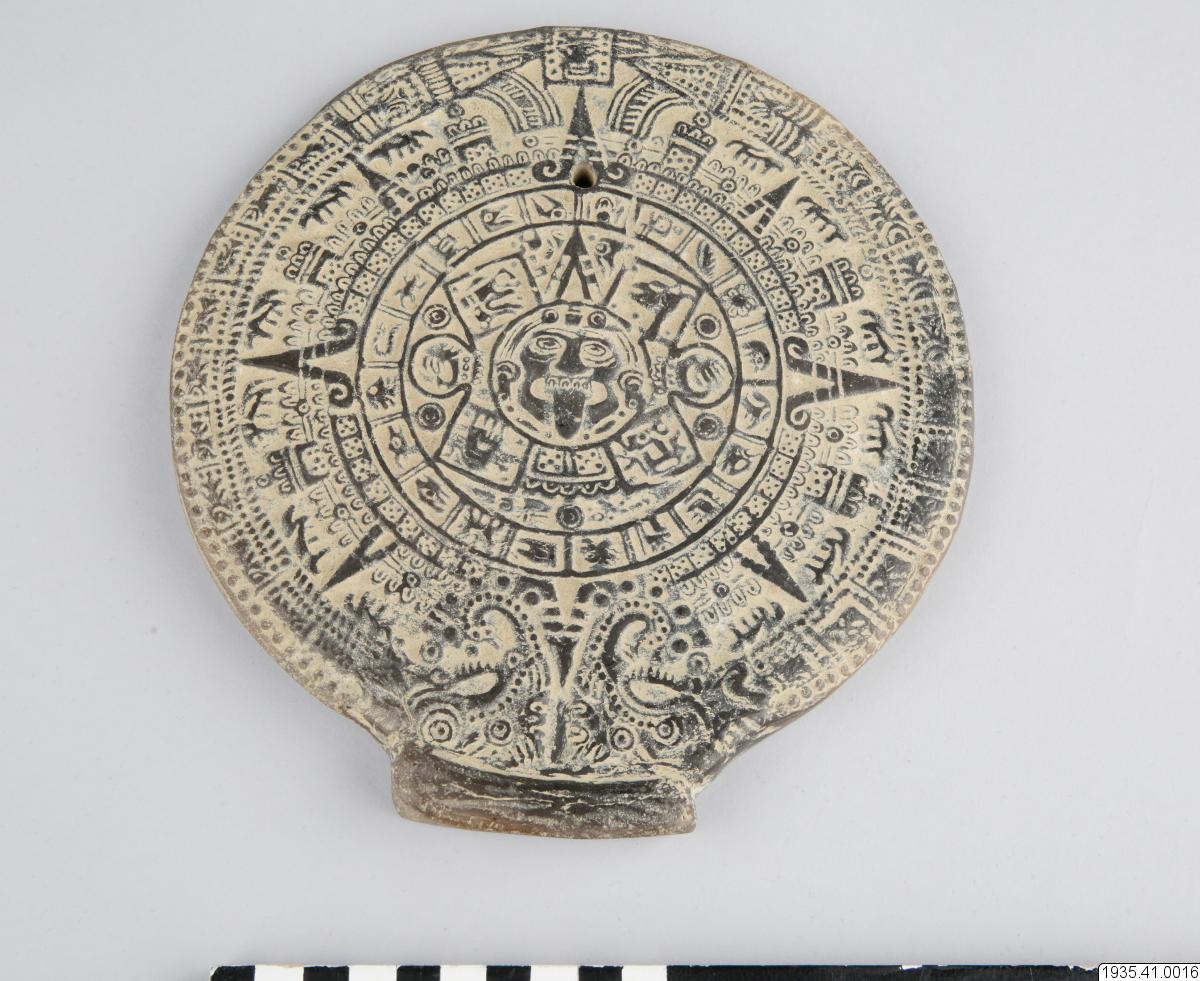 Source: Objaverse 1.0 / Sketchfab
Rising Sun Alley
A small passage off Rising Sun Court, near Smithfield, London. This passage runs down the back of the Rising Sun Pub. Some gravestones can be seen set against the wall on one side. These are probably related to St Bartholomew the Great Church nearby. 642 phots taken in January 2022 with a Sony a7R III and processed in Reality Capture. Source: Objaverse 1.0 / Sketchfab
Sun And Man
 author: Zdeněk Makovský revealed 1986 material: concrete location: Libušina třída, housing estate (Brno-Kohoutovice) Source: Objaverse 1.0 / Sketchfab
Data for: Inversion for Inferring Solar Meridional Circulation: The Case with Constraints on Angular Momentum Transport inside the Sun
<p>Solar meridional circulation profiles inferred by Hatta, Hotta, and Sekii (2024) ("Inversion for Inferring Solar Meridional Circulation: The Case with Constraints on Angular Momentum Transport inside the Sun"). Detailed information about the dataset can be found in a Readme pdf file. </p>
ScienceDex guides
Understand access before you commit
These curated guides explain access requirements, typical timelines, costs, and reuse considerations for widely used research datasets.
Allen Brain Atlas
Allen Brain Atlas is an Allen Institute collection of brain map atlases, datasets, APIs, and analysis tools covering mouse, human, and non-human primate brain resources.
Annotated Behaviour and Observability Dataset (ABODe)
ABODe is a University of Edinburgh DataShare dataset for behavior classification in group-housed mice using home-cage video, identities, bounding boxes, ground-plate positions, and annotator labels.
DANDI Archive for NWB datasets
DANDI is a BRAIN Initiative archive for publishing and sharing neurophysiology data, including electrophysiology, optophysiology, and behavioral data packaged as NWB and related standards.
International Brain Laboratory public data
The International Brain Laboratory public data releases expose standardized mouse decision-making experiments, including Neuropixels recordings, widefield calcium imaging, behavior, and session metadata accessed through the ONE API.
OpenNeuro
OpenNeuro is a free, open platform for sharing neuroimaging datasets, with public search, dataset pages, and download paths for web, S3, DataLad, and the OpenNeuro CLI.