
Find research datasets worth reusing
Search datasets from major research repositories and use ShareScore to quickly assess how well each record supports discovery, access, and reuse.
22
datasets available to search
ShareScore release 0.9.0
Dataset results
22 results for “Trolling”
Public Dataset for "Did State-sponsored Trolls Shape the 2016 US Presidential Election Discourse? Quantifying Influence on Twitter"
<p>Dataset for the "Did State-sponsored Trolls Shape the 2016 US Presidential Election Discourse? Quantifying Influence on Twitter" paper. </p> <p>The full text of the paper can be found <a href="https://zenodo.org/record/4699959#.YngKatNBy3K">here</a>.</p> <p>The folder "Tweet_IDs" contains the complete list of the 152,514,929 tweet IDs (together with their timestamps) which we used for the analysis in the study: "Did State-sponsored Trolls Shape the 2016 US Presidential Election Discourse? Quantifying Influence on Twitter"</p> <p>by Nikos Salamanos, Michael J. Jensen, Costas Iordanou and Michael Sirivianos</p> <p>We have split the tweets into separate .zip files based on the date listed in their timestamps.</p> <p>The crawling took place from September 21 to November 7, 2016 (47 days; we did not collect data on 02/10/2016).</p> <p>Each "tweet_day_X.zip" file contains the file "tweet_day_X.csv", where X in [1,2,...,47]. For instance, the file "tweets_day_1.zip" contains the tweets of the 1st day: 09/21/2016.</p> <p>Please cite the paper in any published work that uses any of these resources. </p> <p>@misc{nikos_salamanos_2021_4699959,<br> author = {Nikos Salamanos and<br> Michael J. Jensen and<br> Costas Iordanou and<br> Michael Sirivianos},<br> title = {{Did State-sponsored Trolls Shape the 2016 US <br> Presidential Election Discourse? Quantifying<br> Influence on Twitter}},<br> month = apr,<br> year = 2021,<br> publisher = {Zenodo},<br> version = 3,<br> doi = {10.5281/zenodo.4699959},<br> url = {https://doi.org/10.5281/zenodo.4699959}<br> }</p>
Trawling for Trolling: A Dataset
<p>This dataset contains 12490 rows of social media content samples distributed between Hate Speech, Derogatory, Trolling, Profanity and Normal. Data source primary from Twitter, Reddit and Wikipedia Talk pages. No metadata about posts is included.</p>
Troll that smells Christian blood
Trold, der vejrer kristenblod (English: Troll that smells Christian blood) is a sculpture made by Niels Hansen Jacobsen (1861-1941). It was modelled between 1895-96, and a bronze cast was ordered by brewer Carl Jacobsen in 1901-02. It was originally placed in front of Jacobsen's church in Valby, Copenhagen, Jesuskirken, but was too controversial for the parish, so it was moved to the garden of Ny Carlsberg Glyptotek. In 2002 the church wanted the sculpture back, but the Glyptotek would not part with it, so a copy was made, and placed in front of the church. The name of the statue is taken from a story in Norse folklore where the hero hides in the troll's castle. Thereafter, whenever the troll enters the castle, he cries: "I smell a Christian man's blood!" 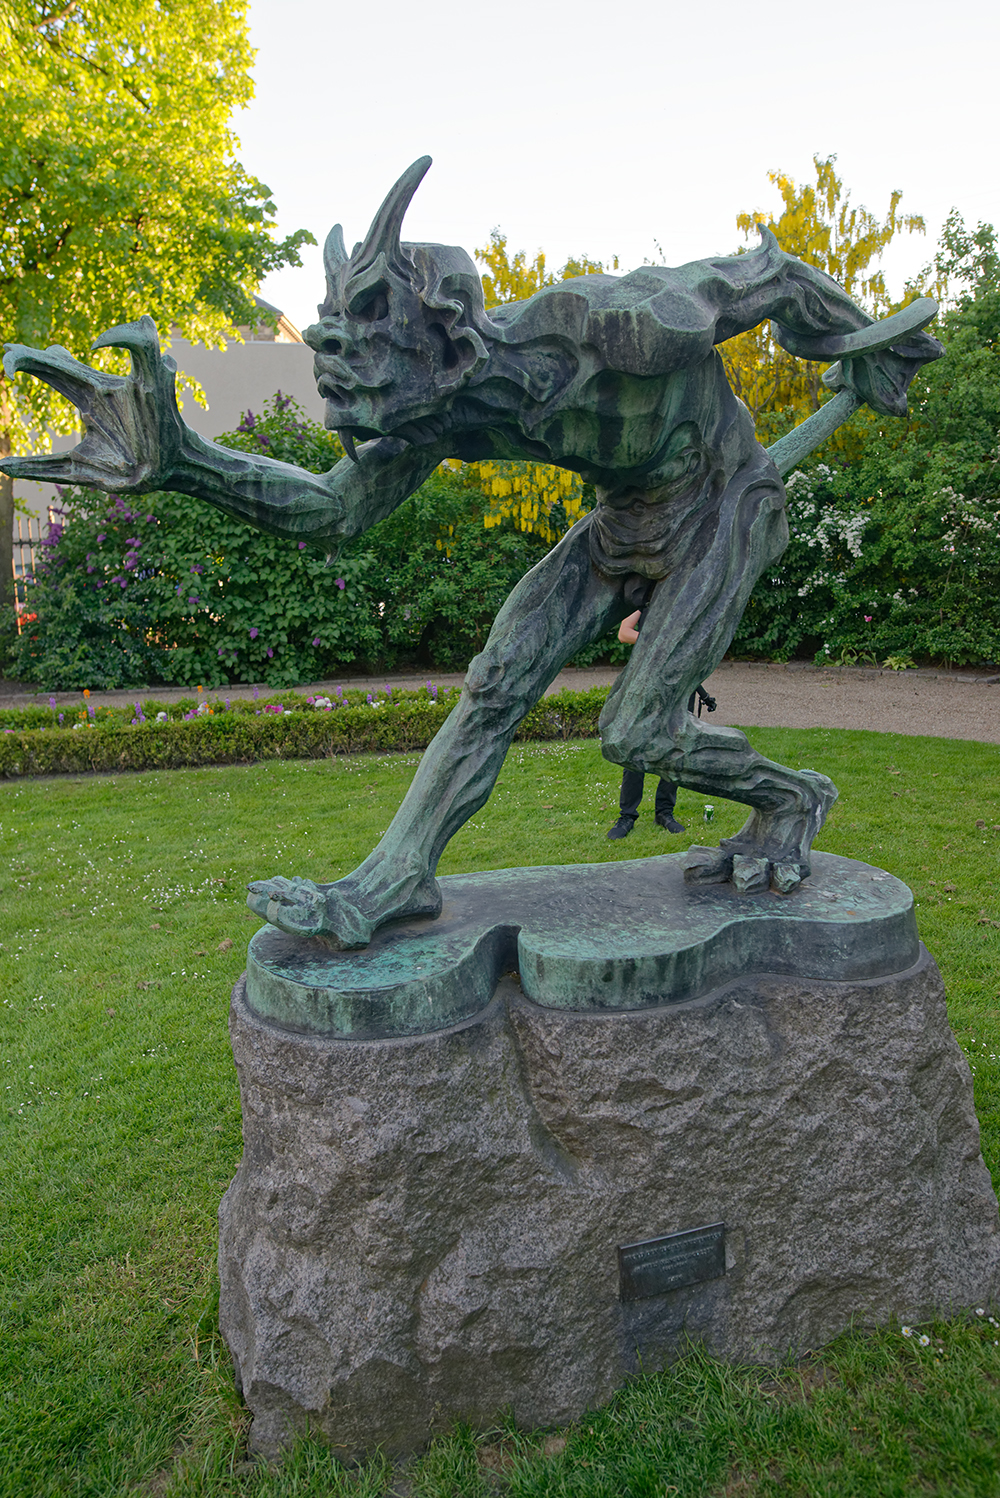 Source: Objaverse 1.0 / Sketchfab
Mountain troll statue (Nomad test 2)
Quick sculpt in **[Nomad Sculpt](https://play.google.com/store/apps/details?id=com.stephaneginier.nomad&hl=enUS&gl=US)** (full version). Smartphone - BV6000s (Android 7). * [**Troll test bust (Nomad test 1)**](https://sketchfab.com/3d-models/troll-test-bust-nomad-test-1-b28bd1af1a5049389045e3869f0f665b) * [**Troll bust (Nomad test 3)**](https://sketchfab.com/3d-models/troll-bust-nomad-test-3-c074ee24fc0946c98fcf3158d5111495/) # **[ArtStation](https://www.artstation.com/artwork/rAKXaE)** *Nomad (1.32.1), Blender (2.91), Substance Painter (2020.2.2)* Source: Objaverse 1.0 / Sketchfab
Fremont Troll Scan with Photogrammetry
Photogrammetry scan of the Fremont Troll in Seattle. Done as a comparison to current LiDAR scanning methods on the iPad, which can be seen here: https://skfb.ly/6YqwD Source: Objaverse 1.0 / Sketchfab
Fremont Troll LiDAR Scan with 3DScannerApp
LiDAR scan of the Fremont Troll in Seattle. Done as a comparison to photogrammetry, which can be seen here: https://skfb.ly/6YqwK Source: Objaverse 1.0 / Sketchfab
Troll
Sculpture monumentale d'environ 3.20 m de hauteur, réalisée en pierre calcaire de Crazannes par Soren Lyngbye. ***Troll est un vieux mot nordique pour désigner un monstre. Selon la croyance populaire, la nature était peuplée de créatures surnaturelles qui se mêlaient des activités des humains et menaçaient ceux-ci. Ces êtres malfaisants étaient la cause d'accidents, de maladies et de la mort. Il fallait donc soit les éviter, soit les amadouer. La nature était dangereuse, il existait des prédateurs comme les loups et les ours. Et puis il y avait les esprits de la nature, produits de la peur et de l'imagination humaines. lLauteur choisi de faire un troll, parce qu'il est fasciné par ces grosses créatures laides qu'il a utilisées comme modèles pour des affiches, des sculptures en bois et des scénographies.*** Source: Objaverse 1.0 / Sketchfab
Dataset from the ground-based TEC and scintillation receiver in Troll station for events on March 18th and 25th, 2018
<p>Here is data from the GNSS Ionospheric Scintillation and TEC Monitor (GISTM) receiver NovAtel GPStation-6 that located at the Norwegian Research Station Troll in Queen Maud Land, Antarctica. The receiver records signals from the GPS, GLONASS, and Galileo satellites. Every minute, it provides extended summary messages, including satellite azimuth/elevation angles, C/NO, lock time, code-minus-carrier, calculations of amplitude (S4) and phase (σϕ) scintillation indices.</p> <p>The data is presented as tables. Each .txt file contains data and a header.</p> <p> </p> <p><span>This work was supported by European Research Council (ERC) under the European Union's Horizon 2020 research and innovation programme (ERC Consolidator Grant agreement No. 866357, POLAR-4DSpace).</span></p>
Dataset for "Who Let The Trolls Out? Towards Understanding State-Sponsored Trolls"
<p>This is the dataset used for the study "Who Let The Trolls Out? Towards Understanding State-Sponsored Trolls". Savvas Zannettou, Tristan Caulfield, William Setzer, Michael Sirivianos, Gianluca Stringhini, Jeremy Blackburn. Arxiv, 2019. DOI: <a href="https://zenodo.org/record/2558560">10.5281/zenodo.2558560</a></p> <p>The dataset consists of the data released by Twitter on October 2018 for Russian and Iranian state-sponsored troll accounts, which is available at <a href="https://about.twitter.com/en_us/values/elections-integrity.html?fbclid=IwAR0ytC6Q_Jawg6ao57H4oWpA4D6wROvYGqDF0E-tI9hoCIEeX4M-BvXAT9s#data">https://about.twitter.com/en_us/values/elections-integrity.html#data</a> as well as intermediate data that we generated after processing the raw data.<br> For instance, we include trained Word2Vec and LDA models, the output of our influence estimation experiments via Hawkes Processes, and a lot of other data necessary to reproduce the results in the paper.<br> To use the provided data simply download the compressed file from <URL> and make sure that the uncompressed <code>data</code> folder is in the same directory as the IPython Notebook.</p> <p>The code used for this study can be found here: <a href="https://github.com/zsavvas/trolls_analysis">https://github.com/zsavvas/trolls_analysis</a></p> <p>Please cite our paper if any publication, of any form and kind results of you using this data:</p> <pre>@article{zannettou2018let, title={Who let the trolls out? towards understanding state-sponsored trolls}, author={Zannettou, Savvas and Caulfield, Tristan and Setzer, William and Sirivianos, Michael and Stringhini, Gianluca and Blackburn, Jeremy}, journal={arXiv preprint arXiv:1811.03130}, year={2018} }</pre>
FIG. 2 in Trolling for water striders: active searching for prey and the evolution of reduced webs in the spider Wendilgarda sp. (Araneae, Theridiosomatidae)
FIG. 2. Probable sequence of attachments by W. sp. near the water surface (schematic and not to scale). It was not clear from behavioural observations whether line a±b was doubled (as in drawing A) or broken and replaced (as it probably is in W. clara); nor was it certain whether point c was on the surface of the water or, more likely, just above it (see ®gure 7). It was con®rmed repeatedly, however, that the sticky line c±d (with balls in drawing C) was added to the non-sticky line rather than replacing it, as the sticky line was seen sagging brie¯y away from the straight vertical line. In two cases favourable lighting angles and background allowed con®rmation that line b±c was added to rather than replaced the line or lines laid just previously (a±b).
FIG. 7 in Trolling for water striders: active searching for prey and the evolution of reduced webs in the spider Wendilgarda sp. (Araneae, Theridiosomatidae)
FIG. 7. Microscopic views of silk on slides (stippled 5 puddles of sticky material; black masses 5 attachment discs, except for (E) where they 5 sticky material). (A) Lines of W. sp. ¯are away from central vertical line within masses of sticky material. (B) Attachment of W. sp. to water, showing attachment disc (presumed initiation of sticky silk) at bottom tip of vertical line. (C) Attachment of BCI creek W. sp. to water, showing attachment disc higher on vertical line and more sparse radial lines. (D) Attachment disc on a slack vertical line of W. sp. above section with sticky balls (e.g. d in ®gure 2), showing greater curliness of non-sticky lines. (E) Puddles of sticky material on a vertical line of W. sp., showing strong concentration of material at lower end of the line. Scale for (A), (C) and (D) at upper left.
FIG. 9 in Trolling for water striders: active searching for prey and the evolution of reduced webs in the spider Wendilgarda sp. (Araneae, Theridiosomatidae)
FIG. 9. Stages of the production of a second vertical line (A±D) and the initiation of a third line (E) by W. clara. The tight new vertical line (A, B) pulled the suspension line downward as the spider made the second descent; the tension then diminished and the angle in the suspension line became less acute (C; compare with B) as the spider extended the vertical line and then moved along the suspension line toward the previous vertical line (C). The spider apparently reeled up the suspension line as it then moved away from line 2 (D), because the white speck at the top of the new vertical line (dots in A±C) disappeared, and a white speck (presumably the accumulated reeled up silk) moved with the spider to the site where the next vertical line was laid (E). The positions of the white specks on the suspension line with respect to the vertical line in (A) ±(C) were not determined by direct observation; they are guesses based on the directions in which the specks moved and new lines were carried.
FIG. 5 in Trolling for water striders: active searching for prey and the evolution of reduced webs in the spider Wendilgarda sp. (Araneae, Theridiosomatidae)
FIG. 5. Probable mechanism used by spiders to jerk objects up out of the water (schematic). The spider ®rst reeled up the line, and thus tensed the entire line. When it then released this silk suddenly, the greater elasticity of the much longer line above the spider caused the spider to be displaced upward (arrow). The momentum of its body produced an upward jerk on the object when the line below its body became tight. This interpretation is tentative, because it was not possible to verify directly that the reeled up line was not broken (as in the drawing).
FIG. 8 in Trolling for water striders: active searching for prey and the evolution of reduced webs in the spider Wendilgarda sp. (Araneae, Theridiosomatidae)
FIG. 8. Tips of radial lines of an attachment of W. sp. to water, showing how they were progressively thinner near their tips (scale 5 0.05 mm).
FIG. 4 in Trolling for water striders: active searching for prey and the evolution of reduced webs in the spider Wendilgarda sp. (Araneae, Theridiosomatidae)
FIG. 4. Production of successive vertical sticky lines (schematic and not to scale). After moving slightly toward previous vertical lines and attaching the vertical line it had just laid (2) to the suspension line, the spider turned 180ss, attached its dragline to the broken end of the suspension line (small dot at the top of vertical line 2), and released silk, causing the two vertical lines to move away from it (arrow in (A); large dot gives a ®xed point of reference). Then it joined the broken ends of the suspension line (small dot at top of vertical line 3 in (B)), and descended to the water to make the next vertical line. Exact sites of broken ends of lines are estimated, as they were not observed directly.
FIG. 3 in Trolling for water striders: active searching for prey and the evolution of reduced webs in the spider Wendilgarda sp. (Araneae, Theridiosomatidae)
FIG. 3. Construction of three types of webs (schematic and not to scale; black balls represent sticky material). (A) The spider climbs to the suspension line after laying an additional short line to the water that was attached to the ®rst vertical line a few centimetres above the water's surface. (B) Spider moves a second vertical line (arrow) so its upper end will be close to or attached to that of the ®rst vertical line. Usually the upper portions of the two vertical lines then merged, resulting in a con®guration like that in (A). (C) Three vertical lines were attached to the suspension line and not subsequently moved.
Dataset from the ground-based TEC and scintillation receiver in Troll station for February 26-27 and March 18-19, 2018
<p>Here present data from the GNSS Ionospheric Scintillation and TEC Monitor (GISTM) receiver NovAtel GPStation-6 that located at the Norwegian Research Station Troll in Queen Maud Land, Antarctica. The receiver records signals from the GPS, GLONASS, and Galileo satellites. Every minute, it provides extended summary messages, including satellite azimuth/elevation angles, C/NO, lock time, code-minus-carrier, calculations of amplitude (S4) and phase (σϕ) scintillation indices, and TEC. The data present after cut-off elevation angle of 30° to solve multipath effects.</p> <p>Time interval: 22:00-08:00 UT on February 26-27 and 17:00-06:00 UT on March 18-19, 2018.</p> <p>The data is presented as tables. Each .csv file contains data and header.</p>
Geochemistry of Cryoconite Holes, Troll Blue Ice Area, Antarctica
<p><strong>Introduction</strong></p> <p>Cryoconite holes, snow and glacier ice were sampled in eight localities of blue ice in the vicinity of Troll Station, Antarctica during December 2019 and January 2020. The samples were collected as part of the Research Council of Norway-funded BIOICE Project (Grant No. 288402) by Prof. Andy Hodson and Dr Aga Nowak.</p> <p>Data are available as a single Excel spreadsheet with two tabs: one containing the chemistry data and the other containing the location and dimension of the holes, where available.</p> <p><strong>Contact</strong>: Andrew.Hodson@unis.no</p> <p><strong>Methods</strong></p> <p>Cryoconite holes in the Troll blue ice area are typically covered by an ice lid, even during summer, when subsurface melting is caused by light penetration through the ice and its absorption by underlying debris particles. Access to the underlying water was therefore achieved first by drilling through the ice lid with a 5 cm Kovacs ice auger. The auger was cleaned at each site before use and the ice chips from the lid were sampled, taking care to ensure a depth-integrated sample was collected in each case. Once the lid was penetrated, a syringe was used to extract water from the hole beneath the lid. Samples of glacier ice were taken by drilling the ice auger into the glacier beside the holes.</p> <p> </p> <p>Samples for major ion analysis (here Ca<sup>2+</sup>, Mg<sup>2+</sup>, Na<sup>+</sup>, K<sup>+</sup>, Cl<sup>-</sup>, SO<sub>4</sub><sup>2-</sup>) were syringe-filtered through 0.45 µm Whatman Puradisc Aqua 30 filters and stored in 50 mL Corning centrifuge tubes after being rinsed with filtrate. The analysis was conducted on Dionex DX90 Ion Chromatographs (University of Sheffield, UK) calibrated in the range 0.01-2 mg L<sup>-1 </sup>for cations and in the range 0.25-2 mg L<sup>-1 </sup>for anions. Precision errors for these ions were all <2% for mid-range standards, while the detection limit was ≤ 0.01 mg L<sup>-1</sup> for cations and 0.05 mg L<sup>-1</sup> for anions (calculated as three times the standard deviation of ten blanks). All ions described above are reported in mg L<sup>-1</sup>.</p> <p>Quantification of NH<sub>4</sub><sup>+</sup>, PO<sub>4</sub><sup>3-</sup>, NO<sub>3</sub><sup>-</sup> and Si in the above samples was conducted using a Skalar San++ Continuous Flow Analyser Autoanalyser (University of Sheffield, UK), calibrated in the range 0-3 mg L<sup>-1</sup>. The limit of detection for these ions was ≤ 0.05 mg L<sup>-1</sup> (calculated as three times the standard deviation of ten blanks). These analyses employed standard colorimetric methods (based on The European Standard EN ISO, 1996, 2002, 2004 and 2005). Samples are reported as mgN L<sup>-1</sup>, mgP L<sup>-1</sup> and mgSi L<sup>-1</sup>, accordingly</p> <p>For both dissolved organic and inorganic carbon (DOC and DIC), a 40mL aliquot was filtered through a Whatman Puradisc Aqua 30 0.45 um pore size filter and stored in Sievers-certified sterilised glass vials. DOC and DIC analyses used the membrane conductometric method of the Sievers 5310 Analyser with UV and persulphate digestion (University Centre In Svalbard, Norway) with a detection limit 0.01 mg L<sup>-1</sup> and < 5% precision errors according to repeat analysis of mid-range (0.4 mg L<sup>-1</sup>) Sievers-certified calibration solutions. All samples are reported at mgC L<sup>-1</sup>.</p> <p>Samples for water isotope analysis were collected as unfiltered 20 mL aliquots in a screw-top HDPE bottle. The bottles were subsampled into 1.5 mL vials with septa closures and loaded into the auto-sampler tray of a CDRS (cavity ringdown laser spectroscopy) instrument (L1102-<em>i</em> Picarro water isotope analyzer and A0211 high-precision vaporiser, University of Cambridge). Each sample was injected nine times and the first three injections were rejected to reduce memory effects from the previous sample. Average values from the remaining six injections were averaged when in-run precision was less than ±0.1 for δ<sup>18</sup>O. Internal standards were run after eight samples and the external reproducibility of these standards was <1‰ 2<em>σ</em>. All results are reported in parts per thousand (‰) relative to V-SMOW.</p> <p> </p>
Cyber Troll dataset
<p>Cyber Troll Dataset </p>
Soft Peripheral Contact Lens for Eye Elongation Control (SPACE):1-year Results of a Double-blinded Randomized Con-trolled Trial
ClinicalTrials.gov study NCT05733884. IPD Sharing: NO. Countries: 1. Publications: 0.
ScienceDex guides
Understand access before you commit
These curated guides explain access requirements, typical timelines, costs, and reuse considerations for widely used research datasets.
Allen Brain Atlas
Allen Brain Atlas is an Allen Institute collection of brain map atlases, datasets, APIs, and analysis tools covering mouse, human, and non-human primate brain resources.
Annotated Behaviour and Observability Dataset (ABODe)
ABODe is a University of Edinburgh DataShare dataset for behavior classification in group-housed mice using home-cage video, identities, bounding boxes, ground-plate positions, and annotator labels.
DANDI Archive for NWB datasets
DANDI is a BRAIN Initiative archive for publishing and sharing neurophysiology data, including electrophysiology, optophysiology, and behavioral data packaged as NWB and related standards.
International Brain Laboratory public data
The International Brain Laboratory public data releases expose standardized mouse decision-making experiments, including Neuropixels recordings, widefield calcium imaging, behavior, and session metadata accessed through the ONE API.
OpenNeuro
OpenNeuro is a free, open platform for sharing neuroimaging datasets, with public search, dataset pages, and download paths for web, S3, DataLad, and the OpenNeuro CLI.