Spectroscopy refers to the interaction between electromagnetic (EM) radiation and matter as a function of its frequency or wavelength.
From this, a number of quantitative and qualitative measurements defining aspects like sample concentrations, structure, chemical compositions etc, can be obtained depending on the spectroscopic technique and spectrum of EM radiation used.
When EM radiation interacts with matter, its frequency can undergo absorption, diffraction, inelastic scattering, emission and impedance by the atoms of the material substance.
In addition, the interaction increases the internal energy transitions of the atoms and depending on the type of EM radiation, it causes the atoms to rotate in the case of microwave radiation, vibrate for infrared, have electron excitation in case of visible light or undergo ionization with UV and x-ray.
Infrared spectrophotometry, also referred to as Infrared spectroscopy (IR spectroscopy) is one of the most useful techniques for structural and functional group analyses and it has been used widely since its inception to identify unknown substances.
This technique utilizes the ability of atoms to absorb infrared frequencies that match their internal vibrational frequency leading to the generation of an absorption spectra specific to the chemical bonds within the sample under analysis.
The technique has found wide applicability in various fields that require identification of organic substances. In research science, IR spectroscopy has been used in chemistry labs to identify and elucidate the structure of chemical substances.
In industry, it has been used in food and drug administration to investigate the presence of (restricted) substances and for quality control to analyze the purity of food and drugs.
The technique has been used in the manufacturing industry to evaluate ongoing reactions by measuring the appearance or disappearance of particular reactants or detecting the formation of polymers.
Infrared spectrophotometry has also been used in the art world to verify authenticity of prized art by testing paint pigments while in forensic science, it has been used to identify substances of interest from crime scenes.
Theoretical Basis of Infrared Spectrophotometry
At temperatures above 0o Kelvin, chemical bonds between atoms are not static, they undergo various types of vibrations, referred to as vibrational modes, which alter the length and angle of bonds.
The type and number of vibrations can range from single stretching vibrational mode seen in diatomic molecules to more complex vibrations found in non-linear polyatomic molecules.
The total number of possible vibrational modes in a molecule can be calculated for both linear and nonlinear molecules using the formula 3n-5 and 3n-6 respectively, where n is the number of atoms in the molecule.
For example, a diatomic molecule like N2 has only one possible vibrational mode while H20, a nonlinear polyatomic molecule, has 3 types of vibrations. Not all molecular bonds are active in infrared spectrum, meaning, not all vibrational modes can be observed.
In infrared spectrophotometry, diatomic molecules that are symmetrical (homonuclear molecules) like N2, Cl2, and certain bonds in polyatomic molecules, like CO2, do not absorb infrared frequency and therefore have no IR spectrum.
This means that one might observe less number of absorption spectrum bands compared to the predicted (by calculation) vibrational mode in a molecule. This is because for a molecular bond to be ‘’Infrared active’’, the vibrational mode must involve change in the dipole moment.
Why do Molecules Only Absorb IR Frequency Resonant to Their Internal Vibrational Frequencies?
When atoms in a molecule absorb EM radiation, they do so in discrete quantities of energy or quanta. Different frequencies of the EM radiation have different levels of energy. The frequencies within the IR spectrum have just enough energy to cause molecules to vibrate.
The lowest vibrational state of a molecule is the ground vibrational state while vibrational states higher than this are called the excited vibrational states.
Molecules will only absorb energy of the frequency that is equivalent to the energy gap required to move them from one vibrational state to the next.
The energy difference between the various vibrational states depends on the bond strength and mass of the elements in the bond. This is why the IR absorption spectra is specific for a particular functional group.
Therefore, what we observe in infrared spectrophotometry is the energy changes required to excite a molecule from the ground vibrational state to subsequent excited vibrational states.
Types of vibrations
The type of vibrations or vibrational modes refers to the changes in the position of the atoms making up the bond. Vibrational modes are divided into two main categories namely, stretching and bending, as follows;
1. Stretching
This involves changes in the bond length between the atoms. The atoms can either move closer to each other, thereby shortening the bond, or further apart.
Stretching can be subdivided into;
- Symmetric stretching: where two atoms simultaneously move toward or away from a central atom.
- Asymmetric stretching: where the two atoms, joined to a central atom, move in different directions.
2. Bending
This type of vibration refers to the changes in the ‘angle’ between two bonds and can further be subdivided into;
- Rocking: where two atoms move either clockwise or anticlockwise on the same plane.
- Scissoring: where two atoms are moving towards or away from each other on the same plane.
- Twisting: when the two atoms are moving out of the plane, where one moves forward and the other backward.
- Wagging: an out-of-plane vibration where the atoms move simultaneously away and toward each other in a v-shape.
Classification of IR regions
The most common classification of the IR spectrum divides it into three IR regions named in relation to their distance from the visible light spectrum as follows;
- The near IR region: This is the range bordering the visible light region, it has the highest energy and the shortest wavelength of the three regions. It traverses the 14000-4000 cm-1 (wavenumber,ῦ ).
- The mid-IR region: This has the range of 4000-400 cm -1 and is the region where most organic substances absorb IR radiation. It is further divided into two ranges – the fingerprint region at 400-1400 cm-1 and the functional group region at 1400-4000 cm-1.
- The far IR region: This borders the microwave spectrum and is in the range of 400-10 cm-1. This region is useful for the analysis of inorganic substances and gases because this is the frequency range where their fundamental vibrations occur.
Infrared spectroscopy in practice
1. Instrumentation for Infrared Spectrophotometry
The infrared spectrometer (or spectrophotometer) measures the relative amount of energy as a function of the wavelength/frequency of the infrared radiation when it passes through a sample.
The two types of the infrared spectrometer are dispersive infrared spectrometer (DS) and Fourier transform infrared spectrometer (FTIS).
2. Dispersive Infrared Spectrometer (DS)
This was the first generation IR spectrometers. The key components are the IF radiation source, entrance slit, monochromator and detector. The source of energy is directed along both a sample and a reference path (for instruments with double beam) and then into the monochromator.
The monochromator splits the IR spectrum into various frequencies and then the slit allows only one frequency at a time to be detected.
The now spatially separated wavelengths of light are directed, by moving the grating through a narrow slit, which chooses which frequencies are being detected, and then onto the detector.
3. Fourier Transform Infrared Spectrometer (FTIS)
The main difference between FTIS and the DS is that the sample is irradiated with all infrared frequencies simultaneously.
To achieve this, a device called an interferometer is used to split the IR light into two beams, one is reflected by a fixed mirror and the second by a sliding mirror, perpendicular to the fixed one.
This means that the path length of the fixed mirror is constant, while the path of sliding mirror keeps changing, creating an optical path difference between the two beams of light.
The two beams recombine again at the beam splitter and are directed to the sample, due to the optical path difference, the resulting graphs form an interferogram which has to be converted to the normal IR absorption spectra using a mathematical technique known as Fourier transformation.
Measurement and Data Interpretation
1. Sample Preparation
This is essential for quality data production. Water, glass, plastic, and other infrared absorbing substances are not used to hold or dissolve samples. Instead, salts and salt plates such as sodium chloride, potassium bromide, silver chloride, diamond dust are used to hold/support the sample material. The type of sample to be tested informs the method of preparation.
Solid samples can be crushed into a powder and made into a paste using mineral oil, dissolved in a non-reactive solvent or pressed into a very thin plate using a hydraulic press.
The powder sample is mixed with a specific kind of mineral oil and the paste is smeared evenly on the salt plates for reading. For solids that can be made into solutions, ensure that the solvent does not react with the sample.
After samples dissolves, transfer a drop onto the salt plates for measurement. The thin and transparent pressed sample is made by mixing the ground solid with ground potassium bromide that is approximately 100 times its weight.
Both sample and potassium bromide need to be finely ground because large particles can scatter the IR beam.
Liquid samples are put between two highly polished salt plates such as sodium chloride plates, so as to evenly flatten the sample droplet, then, mounted onto the sample holder for reading.
Gaseous samples are put in salt cells of about 5-10 cms length.
2. Data Analysis
The infrared absorption spectra is usually presented as the percentage transmittance on the y-axis against the wavenumber (and rarely as wavelengths in nm) on the x-axis which is at a range beginning at about 14000-10 cm-1 with most organic substances having an absorption spectra ranging between 4000-400 cm-1.
The graph shows ‘’peaks’’ and ‘’dips’’ where absorption of radiant energy is represented by a dip in the curve with zero transmittance corresponding to 100% absorption of light at a particular IR frequency.
A peak represents low absorbance where 100% transmittance of light represents zero absorbance at a particular frequency. Sometimes, the graph can be presented in terms of % absorbance on the y-axis in which case the peaks and dips are inverted.
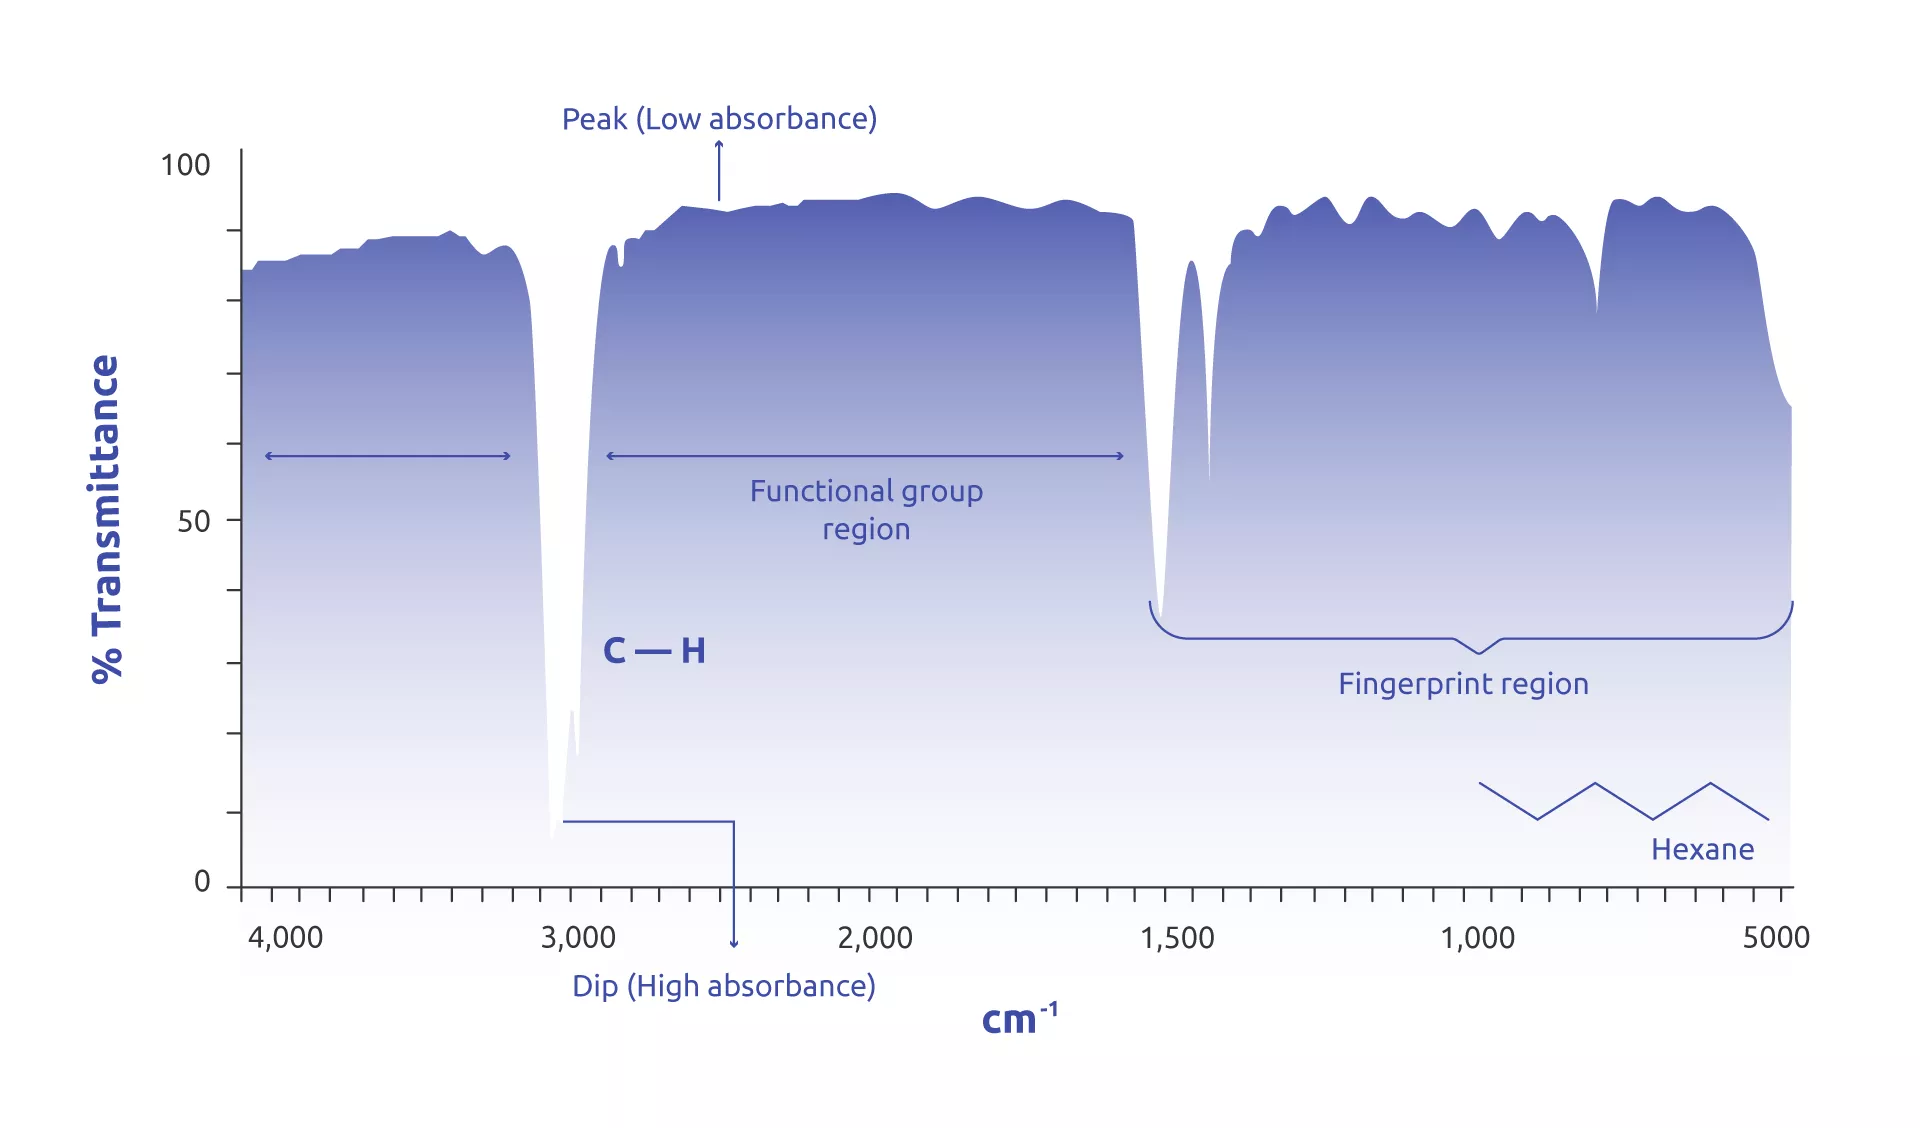
Figure 1: An absorption spectrum showing absorption at 3000-2900 cm-1 which is a characteristic of a tetrahedral C-H functional group. The absorption bands at the fingerprint region are used to further pin-point the compounds
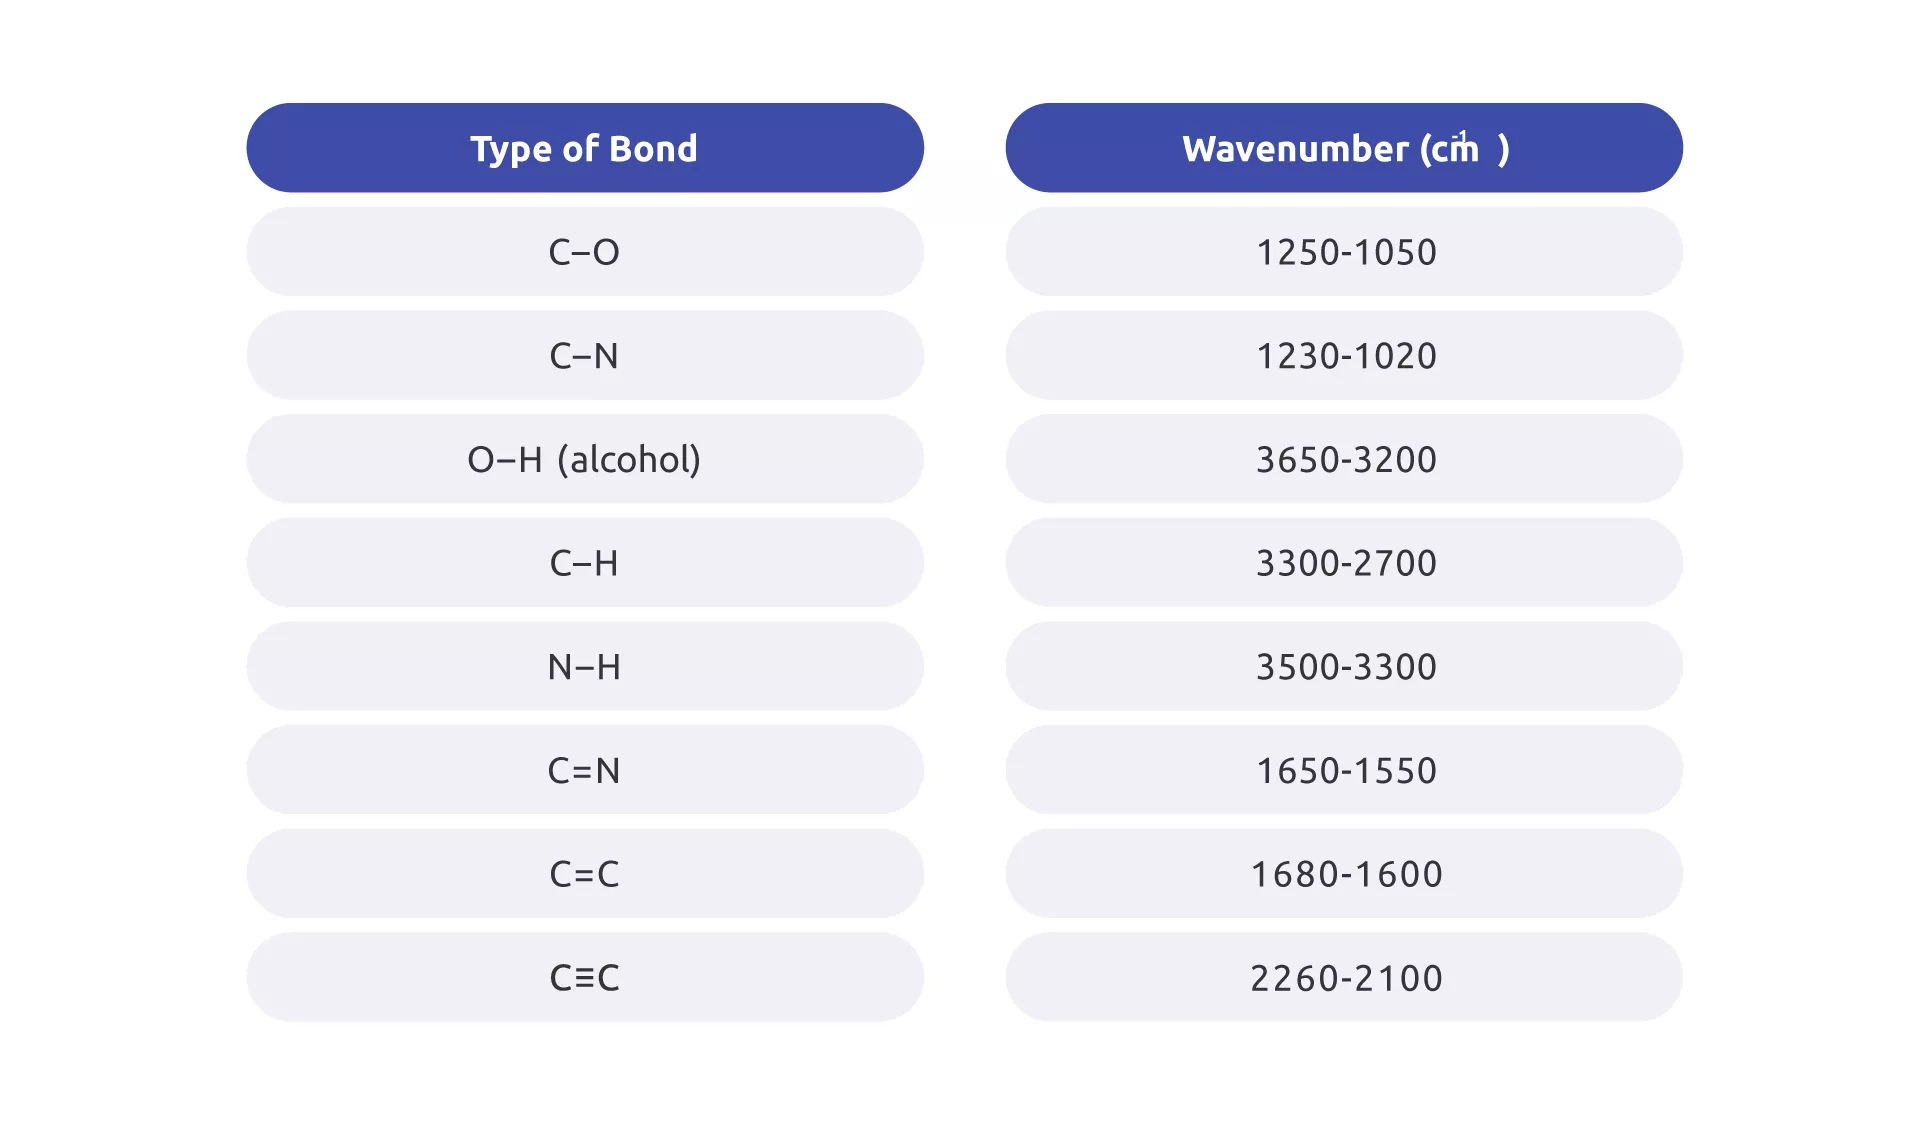
Table 1: The stretching frequencies of different bonds. Such reference tables are used to interpret the absorption bands data.
Since the vibrational frequencies of a given functional group correspond to the absorption of a certain frequency, the absorption spectra of a sample are compared with the spectrum of various stored data to identify functional groups in the sample.
General Applicability of Infrared Spectrophotometry
Advantages
- You can obtain both qualitative (structure, functional groups present) and quantitative (amount of substances in sample) data.
- Samples in a variety of states can be investigated. This includes; liquid, gas, films, surfaces, pastes, powders, solutions, etc.
- Different IR regions can be tailored to specific applications, e.g. far IR region to analyze inorganic substances, mid-IR region for organic species, and near IR regions for routine quantitative analysis.
- Data interpretation of the commonly used mid IF region is easy; the peak intensities, peak positions, peak widths, and shapes can be easily read and information quickly extracted.
- FTIR spectrometer is able to obtain data fast with a better signal-to-noise ratio.
- IR spectrophotometry is a non-destructive method of analysis, the sample remains intact.
Disadvantages and Limitations
- IR spectrophotometry does not give information on molecular mass or the relative position of different functional groups.
- A single IR absorption spectrum on an unknown substance cannot verify if the substance is pure or a mixture of different compounds.
- Materials such as plastic and glass absorb IR and therefore cannot be used in the IR spectrophotometer.
- Since water intensely absorbs infrared, samples cannot be analyzed in their aqueous form by an IR spectrometer.
- The dispersive spectrophotometer is comparatively slow with low sensitivity.
Infrared spectroscopy is a powerful method for investigating the structure, functional groups, and compositional changes in organic and inorganic molecules in varied forms. In combinations with other instruments like mass spectrophotometer, NMRI, or microscopes, it forms a part of a powerful analytical tool.
References
- Kamariotis, A.; Boyarkin, O. V.; Mercier, S. R.; Beck, R. D.; Bush, M. F.; Williams, E. R.; Rizzo, T. R. J. Am. Chem. Soc. 2006, 128, 905
- Peter J. Larkin. “Infrared and Raman Spectroscopy. Principles and Spectral Interpretation” Chapters 1 to 6. Radarweg 29, PO Box 211, 1000 AE Amsterdam, The Netherlands. Elsevier 2011
- Marwa El-Azazy. Introductory Chapter: Infrared Spectroscopy – A Synopsis of the Fundamentals and Applications, Infrared Spectroscopy – Principles, Advances, and Applications. 2018. IntechOpen, DOI: 10.5772/intechopen.82210
- Donald L. Pavia, Gary M. Lampman and George S. Kriz. “Introduction to Spectroscopy. A Guide for Students of Organic Chemistry” Chapter 2. Thompson Learning. United States of America 2001.