Individual composite indices
EPM anxiety index, FST immobility ratio, OF exploration index, LD preference score, sociability index, and sucrose preference — each computed from paradigm-specific raw data.
CSVJSON
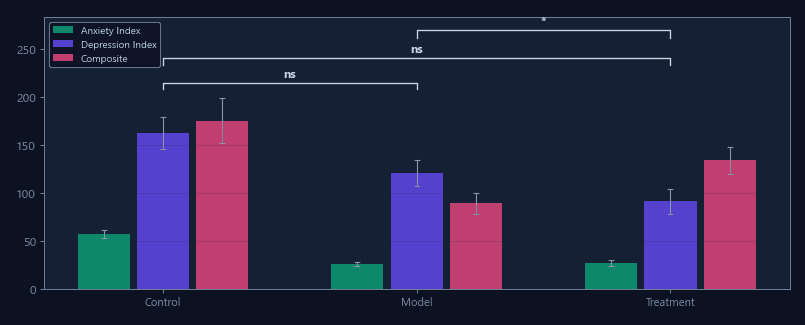
Composite behavioral indices across anxiety and depression batteries
Automatically compute EPM anxiety index, FST immobility ratio, and multi-test Z-score behavioral profiles — standardized composite scores from raw tracking data.
No single behavioral test captures the full anxiety or depression phenotype. Labs run batteries of 3-5 tests, but integrating results into composite indices requires custom spreadsheets, Z-score normalization against control groups, and manual profile construction.
ConductVision computes standard composite indices from raw tracking data: EPM anxiety index, FST immobility ratio, light/dark preference score, open field exploration index, sociability index, and sucrose preference ratio. Z-score profiles across the full battery are generated automatically.
EPM anxiety index, FST immobility ratio, OF exploration index, LD preference score, sociability index, and sucrose preference — each computed from paradigm-specific raw data.
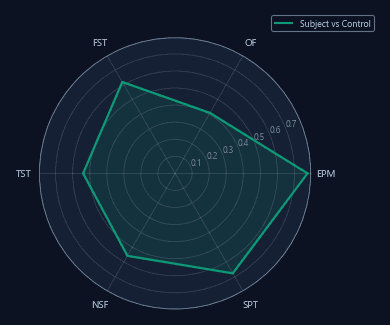
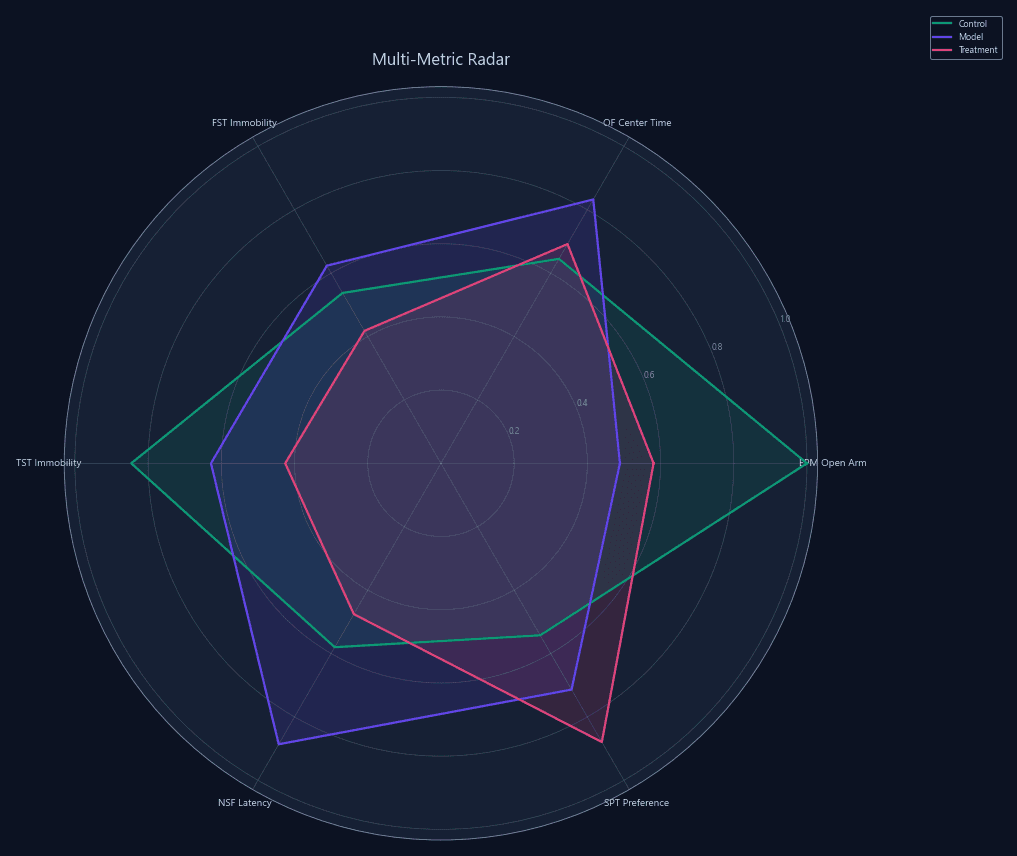
All indices normalized to control group as Z-scores. Enables within-subject comparison across tests and detection of mixed phenotypes.
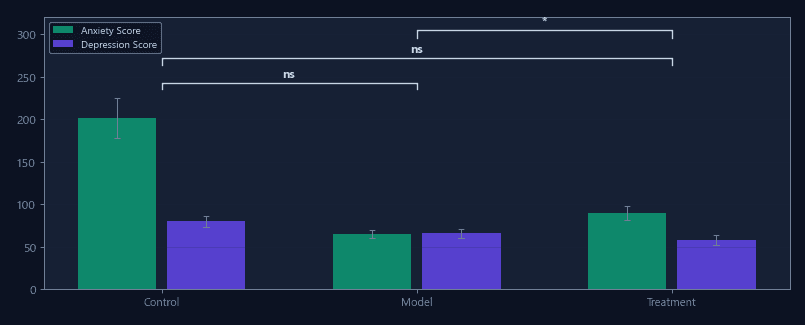
Treatment vs. control composite index comparison with effect sizes and significance testing across all battery tests.
Composite indices across the anxiety/depression battery provide a multi-dimensional drug profile rather than a single-test result.
Z-score profiles across the full battery reveal whether a genetic manipulation produces a pure anxiety phenotype, depression phenotype, or mixed profile.
Compare male and female Z-score profiles to detect sex-dependent effects that single-test analysis might miss.
Pre- and post-stress behavioral profiles quantify the breadth and severity of stress-induced behavioral changes.
| Feature | ConductVision | Typical systems |
|---|---|---|
| Composite index calculation | Built-in, automatic | Manual spreadsheet or custom scripts |
| Z-score normalization | Automatic against control group | Manual calculation |
| Multi-test profile | Integrated battery visualization | Separate per-test reports |
| Standard indices included | 6 validated indices | 0-1 built-in |
| Group comparison | Built-in with effect sizes | External software required |

Automated light/dark box anxiety assessment with transitions, latency, and compartment dwell time.

Automated rearing event detection distinguishing wall-supported and unsupported vertical activity.

Dual-mode automated freezing scoring with TTL/serial apparatus integration for fear conditioning paradigms.
Upload results from multiple behavioral tests and generate composite indices automatically.