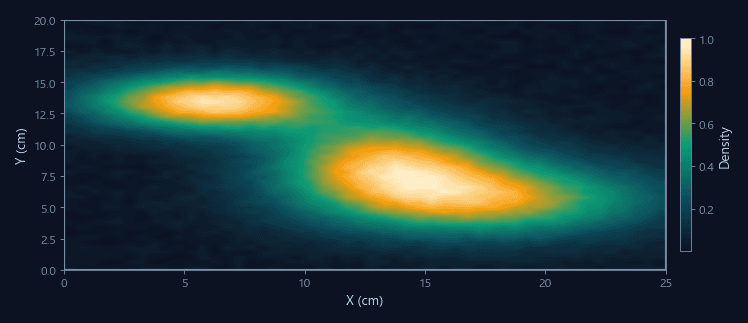
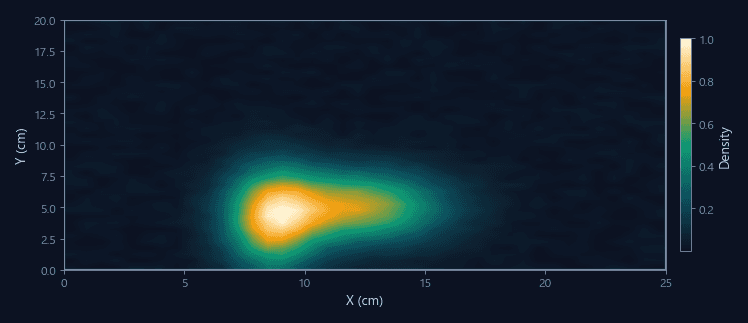
Cumulative occupancy heatmap
Pixel-level dwell time density exported as PNG with arena overlay. Configurable normalization — absolute seconds or percentage of total session.
PNGTIFF
Spatial occupancy heatmaps that reveal where behavior happens
Color-coded density maps overlay directly on the arena view — see thigmotaxis, zone preference, and spatial bias at a glance without processing raw coordinate data.

Thousands of X/Y data points per session make it difficult to see where animals actually spend time. Spreadsheet analysis of zone occupancy misses gradients, edge preferences, and micro-regions that heatmaps expose instantly.
ConductVision generates pixel-level heatmaps in real time during tracking. Cumulative occupancy builds frame by frame, and the final map exports as a publication-ready image with configurable color scales.
Pixel-level dwell time density exported as PNG with arena overlay. Configurable normalization — absolute seconds or percentage of total session.
Sequential heatmaps at configurable intervals (e.g., 1-minute bins) showing how spatial preference evolves across the session.
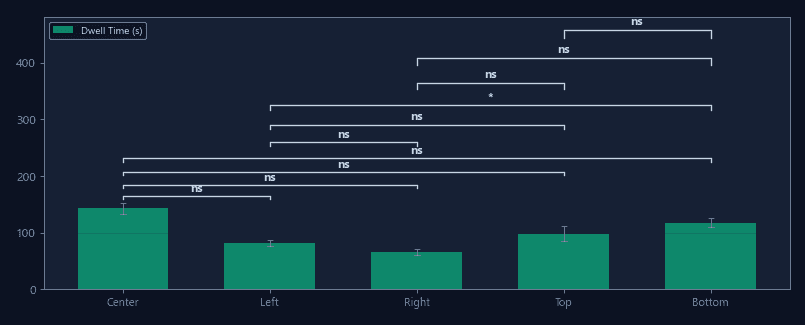
Quantified dwell time per defined zone derived from the heatmap — center, periphery, quadrants, custom polygons.
Heatmaps instantly reveal wall-hugging behavior. Anxious animals produce a distinct peripheral ring pattern versus exploratory animals with distributed center occupancy.
Heatmap progression across training days shows transition from random search to directed navigation to the hidden platform.
Three-chamber heatmaps reveal whether animals spend more time near the social stimulus versus the empty cage or novel object.
Pre- and post-conditioning heatmap comparisons show whether the animal has developed preference for the drug-paired compartment.
| Feature | ConductVision | Typical systems |
|---|---|---|
| Live heatmap during session | Yes — updates at 30 fps | Post-hoc only in most systems |
| Spatial resolution | Pixel-level (1280x720) | Grid-binned (10x10 typical) |
| Time-binned series export | Configurable intervals | Usually single cumulative map |
| Color palette options | 5 scientific palettes | 1-2 fixed palettes |
| Arena overlay export | Heatmap + arena composite | Separate files, manual overlay |

Configurable spatial zones with automated dwell time, entry count, and heatmap analysis for any arena.

High-resolution 30 fps tracking that captures sub-second behavioral events conventional systems miss.

Automated spatial movement strategy classification with 8 locomotor pattern types.
Upload a recording and generate a publication-ready heatmap in under a minute.