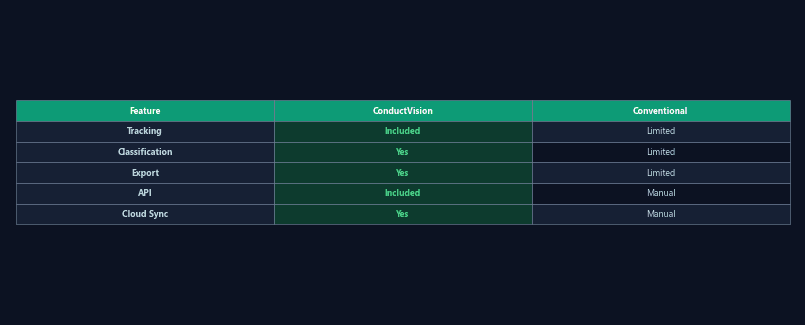
Feature comparison matrix
Capability-by-capability comparison across ConductVision, EthoVision, ANY-maze, DeepLabCut, and SLEAP. Covers tracking, analysis, output, and integration features.
WebPDF
Feature and performance comparison with established tracking platforms
Side-by-side comparison on capabilities, accuracy, species support, and cost — the information you need for software evaluation and grant justification.

Comparing tracking platforms means reading multiple vendor websites, requesting quotes, and running separate evaluations. Feature lists use different terminology, making direct comparison difficult.
ConductVision provides a structured comparison across the features, accuracy metrics, species coverage, and pricing that matter for your evaluation — using consistent terminology and published data.
Capability-by-capability comparison across ConductVision, EthoVision, ANY-maze, DeepLabCut, and SLEAP. Covers tracking, analysis, output, and integration features.
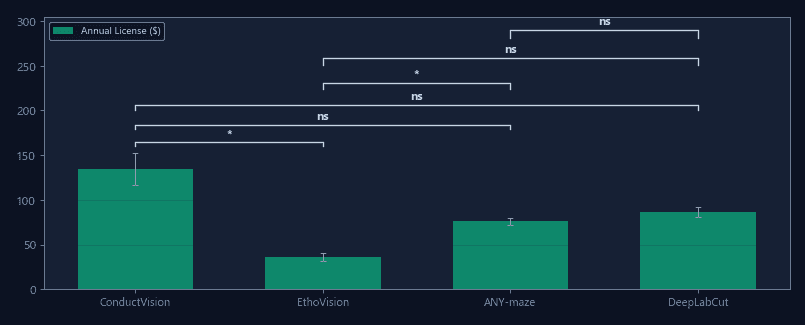
Annual license and total cost of ownership comparison including required hardware, add-on modules, and maintenance fees.
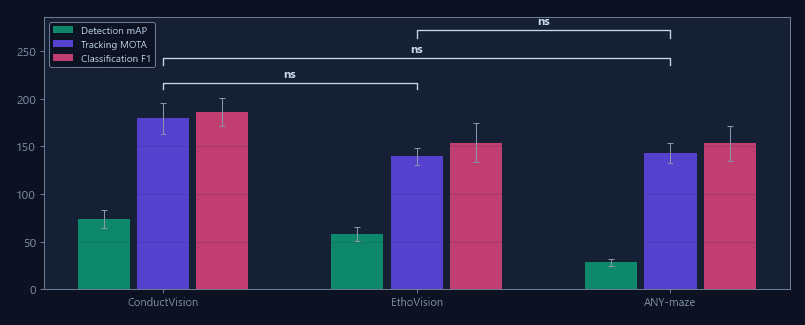
Detection and tracking accuracy compared across platforms using the same test recordings and evaluation criteria.
Use the feature matrix to identify which platforms support your specific paradigm, species, and analysis requirements before investing time in trials.
Cite published accuracy benchmarks and cost comparisons in equipment justification sections. Reviewers can verify claims independently.
Identify feature gaps and overlaps when transitioning from an existing platform. Understand which workflows require adaptation.
Reference the comparative analysis to explain why ConductVision was selected over alternatives in your methods section.
| Feature | ConductVision | Typical systems |
|---|---|---|
| Annual license | $1,490 | $4,000 – $12,000+ |
| Paradigms supported | 24 validated | 10-15 typical |
| Multi-animal (markerless) | Up to 4 | 2 with markers |
| Real-time analysis | During acquisition | Post-hoc only |
| Published benchmarks | Per-paradigm mAP/recall | Overall accuracy only |
| Apparatus integration | TTL, serial, event-stamped | TTL only or none |

Per-paradigm accuracy benchmarks with published precision, recall, and mAP scores across all 24 supported tests.

High-resolution 30 fps tracking that captures sub-second behavioral events conventional systems miss.

Standard CSV/JSON export compatible with any statistical software or analysis pipeline.
Download the trial and run the same recordings through ConductVision to see the difference firsthand.