ConductVision Organoid Monitor
Growth and shape for every organoid
A pilot measures each organoid's size, growth rate and shape from camera images taken every few minutes, through the whole experiment.
Measures
What a pilot measures
Size
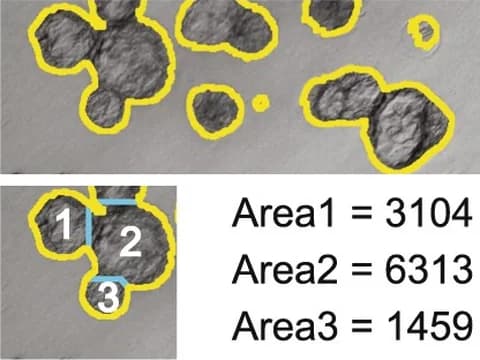
- Projected area
- Equivalent, largest and smallest diameter
- Feret diameter and perimeter
- Volume, only where the shape supports an estimate
Growth
- Absolute and percentage growth
- Growth per hour and per day
- Speeding up and slowing down
- Doubling time, where it applies
- Time to growth arrest, and how long it lasts
- Shrinkage and regrowth rates
Shape
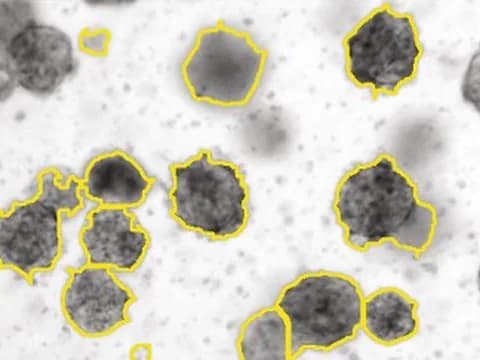
- Circularity and roundness
- Eccentricity and aspect ratio
- Solidity and convexity
- Symmetry and boundary roughness
Surface
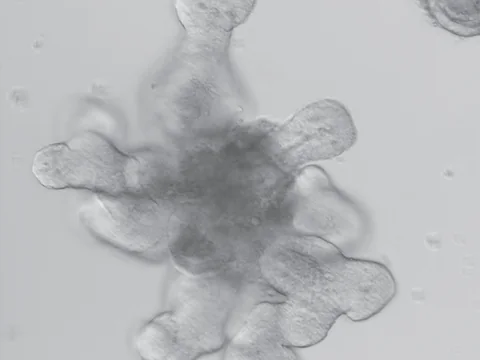
- Protrusions
- Buds and branches, with their count, length, width and angle
Buds and branches are counted only where the camera resolves them.
Lumens
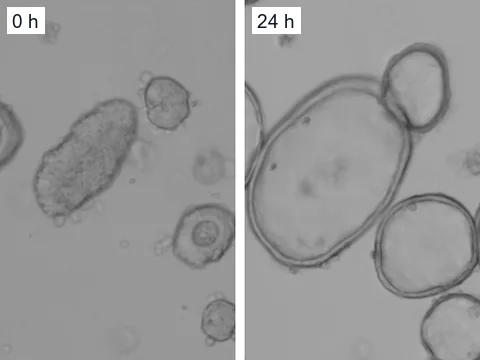
- Count and area of visible lumens, and the share of the organoid they fill
- Lumen expansion, contraction, fusion and collapse
A pilot reports lumens only in organoids large and clear enough to show them, and turns lumen measurements off for the rest.
Appearance
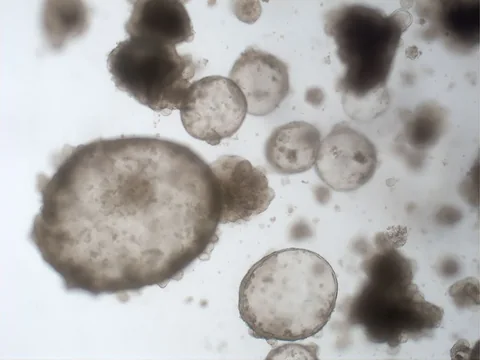
- Brightness, contrast and opacity
- Color and texture
- Differences between center and edge
These measurements describe the image. A pilot labels an organoid's condition only after checking it against your own assay.
Growth
Growth as a continuous curve
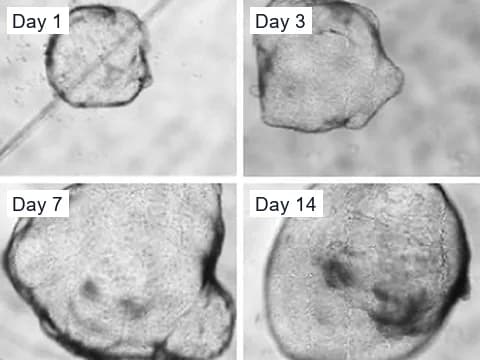
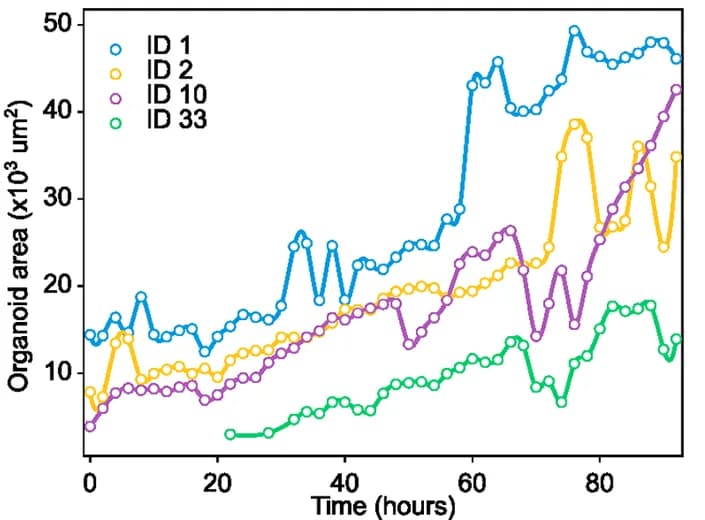
Images every few minutes give each organoid a growth curve. The curve shows when growth speeds up, slows or stops, and how long an arrest lasts.
Kassis and colleagues note that imaging artifacts make organoid shape and growth hard to measure in a 3D matrix.1 A pilot checks every frame for image problems, such as poor focus, before it measures growth.
The team behind OrBITS, a published time-lapse tool, advises judging drug response by growth rate.2 A pilot reports a growth rate for every organoid at every time point.
Shape
Shape and lumen changes over time
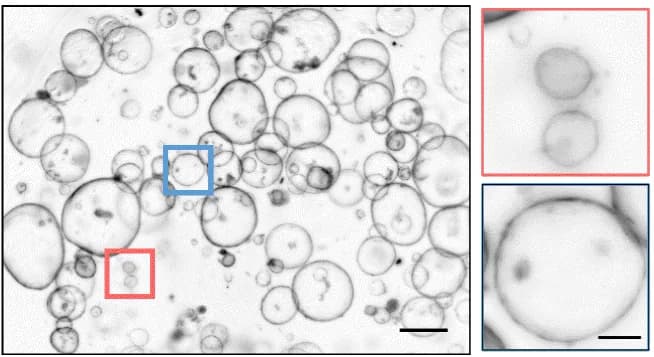
OrganoID tracked a gemcitabine dose-response experiment from microscope images.3 At higher doses, organoid circularity and solidity fell and eccentricity rose, with moderate to large effects.3 In mouse pancreas organoids, Hof and colleagues saw lumens grow and shrink in cycles, and smaller organoids collapsed more often.4
With shape measured at every time point, each change gets a start time.
Limits
Where camera measurements stop
Camera images show whole organoids, along with buds and lumens large enough to resolve. Cells, and anything inside them, need a microscope.
Camera specification
The camera these measurements need
Size and shape need each organoid's outline sharp, whatever its depth in the gel.
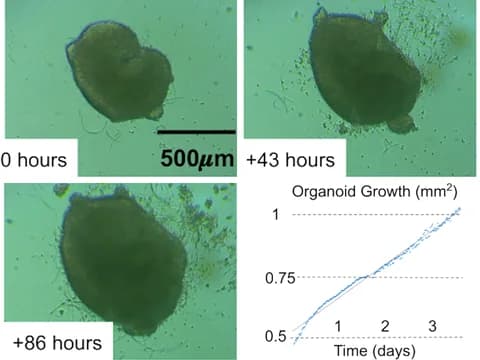
Image scale
- 2 µm or less per pixel
- A lens that resolves group 7, element 1 of a USAF 1951 resolution chart, whose lines are about 4 µm wide, through a culture plate
The Picroscope, an incubator camera system from another group, resolved the same chart element across a field about 5 mm wide and measured organoid area from its images.5 Each pilot report states the smallest organoid measured for size and for shape.
Focus
- Focal planes close enough that every organoid is sharp in at least one, through the full height of the gel
- Each organoid measured in the plane where it is sharpest
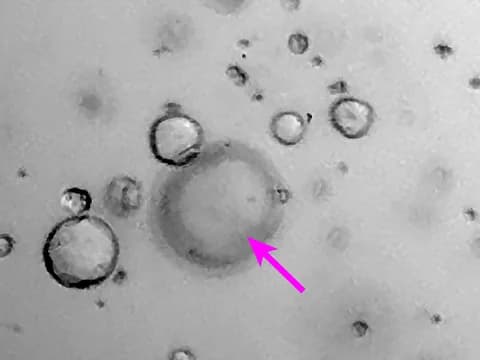
Organoids grow at different depths in a gel, so a single image blurs some of them, even through a low-magnification objective.6 Spiller and colleagues imaged 23 focal planes from 20 to 460 µm, 20 µm apart.7
Light
- Brightfield, with white LED light passing through the well to the camera
- Lights on only while a picture is taken
- Each image normalized to its own background
- No fluorescence
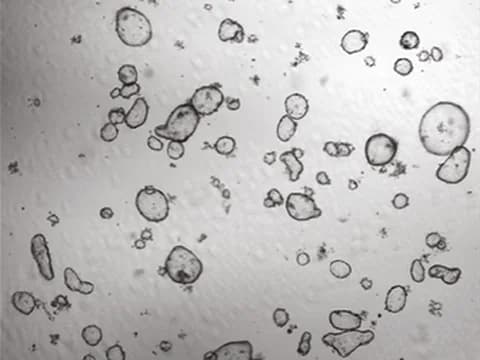
Spiller and colleagues imaged in brightfield to limit phototoxicity and photobleaching.7
Deliverables
What the pilot delivers
- A growth curve for every organoid
- Size and shape tables at every time point
- Well and plate summaries, with the spread across organoids, wells and batches
- Flags wherever image quality was too low to measure
References
- Kassis T, Hernandez-Gordillo V, Langer R, et al. (2019). OrgaQuant: Human Intestinal Organoid Localization and Quantification Using Deep Convolutional Neural Networks. Scientific Reports.
- Deben C, De La Hoz EC, Compte ML, et al. (2023). OrBITS: label-free and time-lapse monitoring of patient derived organoids for advanced drug screening. Cellular Oncology.
- Matthews JM, Schuster B, Kashaf SS, et al. (2022). OrganoID: A versatile deep learning platform for tracking and analysis of single-organoid dynamics. PLOS Computational Biology.
- Hof L, Moreth T, Koch M, et al. (2021). Long-term live imaging and multiscale analysis identify heterogeneity and core principles of epithelial organoid morphogenesis. BMC Biology.
- Ly VT, Baudin PV, Pansodtee P, et al. (2021). Picroscope: low-cost system for simultaneous longitudinal biological imaging. Communications Biology.
- Borten MA, Bajikar SS, Sasaki N, et al. (2018). Automated brightfield morphometry of 3D organoid populations by OrganoSeg. Scientific Reports.
- Spiller ER, Ung N, Kim S, et al. (2021). Imaging-Based Machine Learning Analysis of Patient-Derived Tumor Organoid Drug Response. Frontiers in Oncology.
- Gulieva RE, Ahmadvand P, Freedman BS (2025). A novel rapalog shows improved safety vs. efficacy in a human organoid model of polycystic kidney disease. Stem Cell Reports.
- Goveas N, Waskow C, Arndt K, et al. (2021). MLL1 is required for maintenance of intestinal stem cells. PLOS Genetics.
- Lefferts JW, Kroes S, Smith MB, et al. (2024). OrgaSegment: deep-learning based organoid segmentation to quantify CFTR dependent fluid secretion. Communications Biology.
- Yu H, Lin C, Chen F, et al. (2025). Dose response test of patient-derived cancer organoids to irradiation. Frontiers in Oncology.
Measure growth and shape in a pilot
Tell us your organoid type, your plates and the growth question you want answered.