ConductVision Organoid Monitor
Every visible organoid, monitored 24/7
In a pilot, cameras image your organoid plates 24/7, every 5 to 15 minutes, and ConductVision measures each visible organoid's size, shape, movement and events such as fusion.
Data points
What a pilot records for every organoid
Each visible organoid gets its own time series, and each well gets a summary.
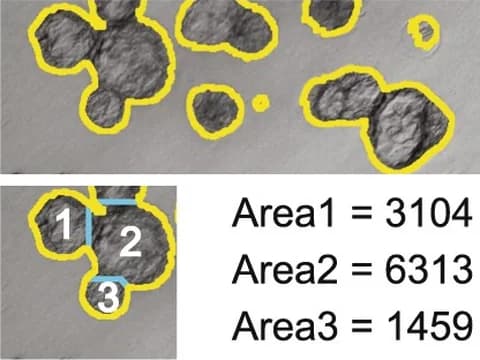
Size
- Projected area
- Diameter, longest and shortest
- Perimeter
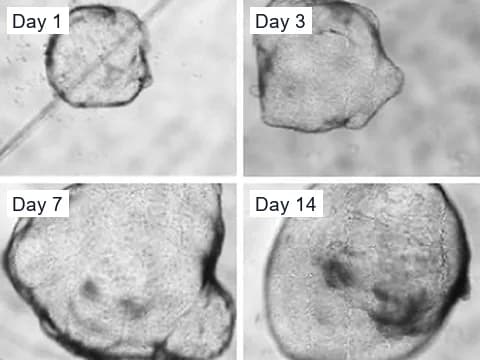
Growth
- Growth per hour and per day
- Area doubling time, while growth is steady
- Growth arrest, shrinkage and regrowth
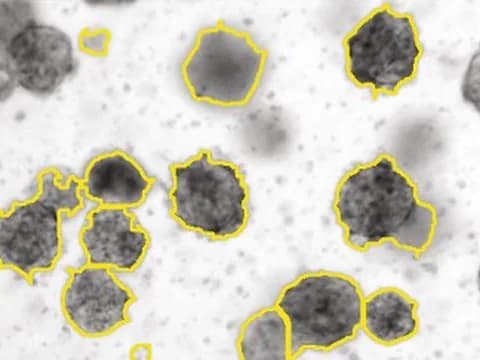
Shape
- Circularity and roundness
- Eccentricity and aspect ratio
- Solidity and convexity
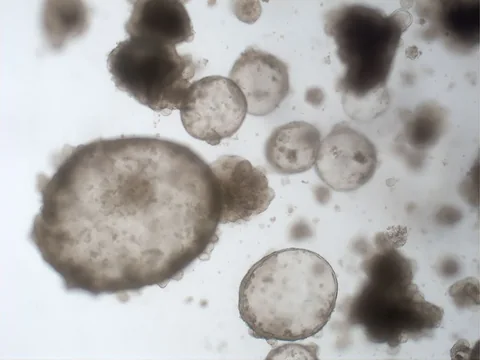
- Buds and visible lumens, where the camera resolves them
Movement
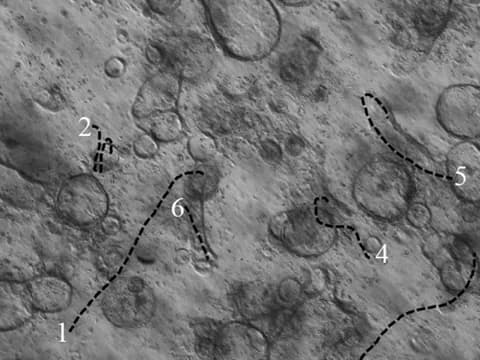
- Position, distance and speed
- Contact with neighbors
Events
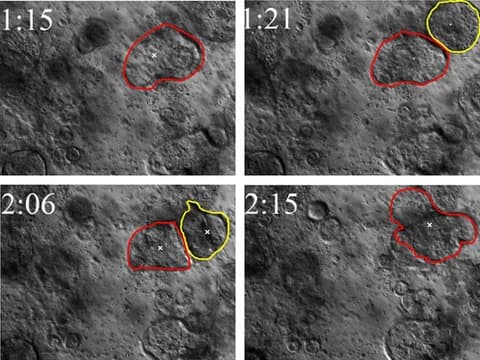
- Fusion
- Fragmentation
- Structural collapse
- Changes unlike the organoid's own history or its neighbors, each with its clip
Each well
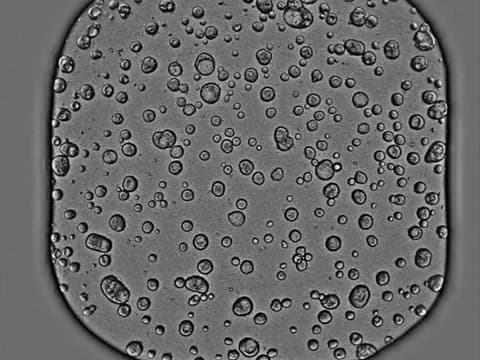
- Count of visible organoids
- The spread of size and shape
- Growth, shape and event rates in each treated well, against the controls you mark
In every data file
- A row per organoid per time point, keyed by plate, well, organoid ID and time
- Sizes in micrometers and times in hours
- Parent and new IDs after each fusion or fragmentation
- A quality flag on every measurement
- CSV, JSON or Parquet
Time series
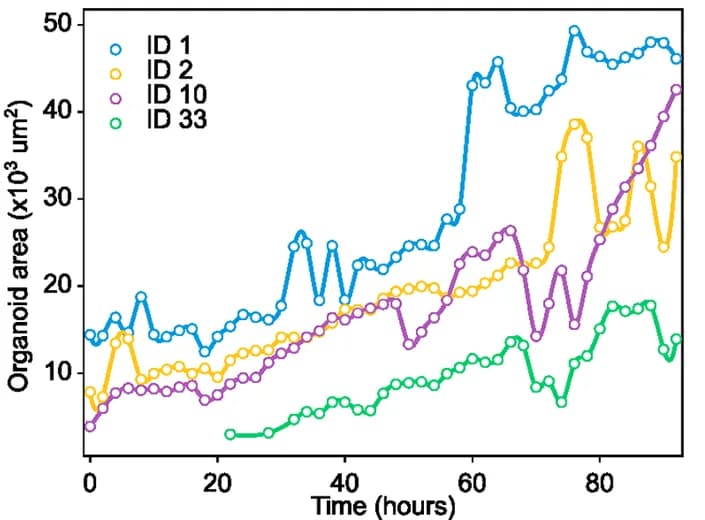
A growth curve for every organoid
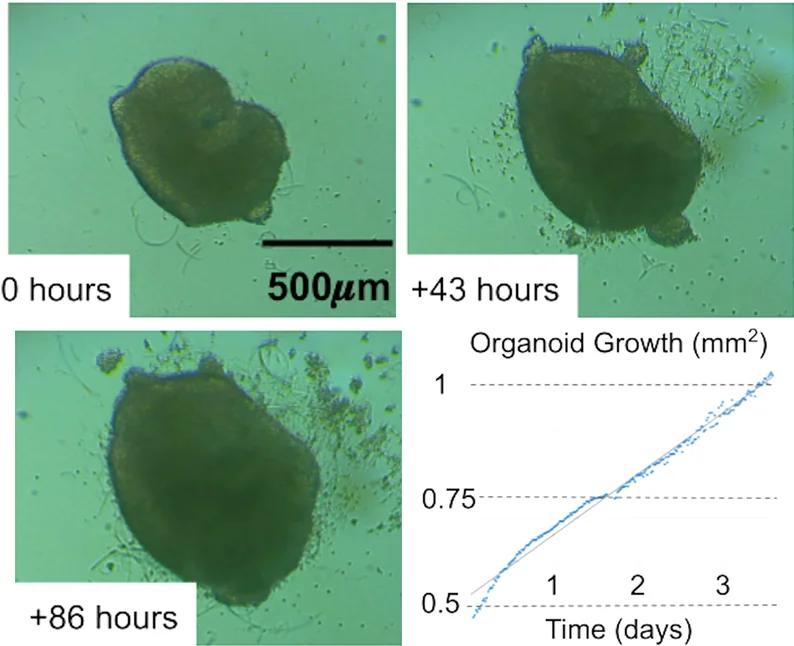
Each curve follows one organoid, measured automatically across a 92-hour time-lapse.1 A pilot keeps a curve like these for each visible organoid, with its shape and events.
What a pilot covers
Four parts of an organoid pilot
Adapted from Yu et al. 2025 · CC BY 4.0 Growth and shape
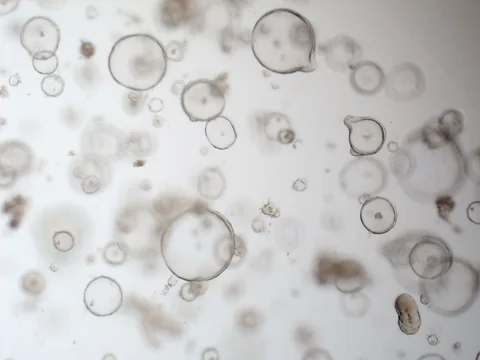
Size, growth rate and shape for each organoid, measured around the clock for the whole experiment.
Growth and shape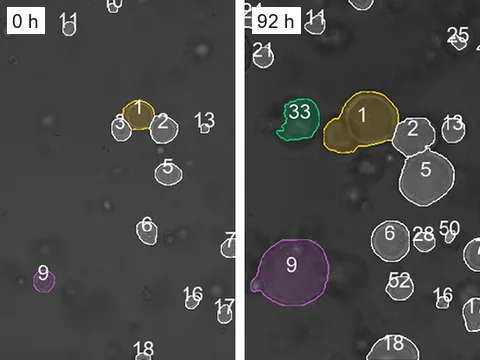
Adapted from Matthews et al. 2022 · CC BY 4.0 Tracking and events
Each visible organoid followed under its own ID, with its moves, fusions, fragmentations and collapses logged.
Tracking and events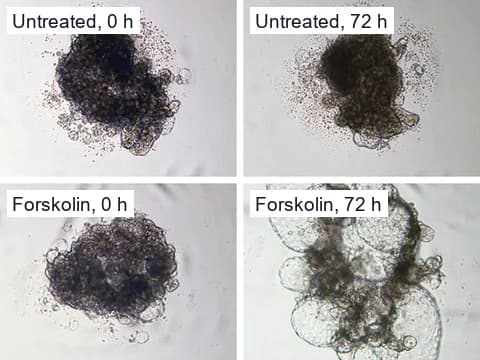
Adapted from Rohe et al. 2026 · CC BY 4.0 Treatment response
When a treatment starts to act, on which organoids, and whether they recover or regrow.
Treatment response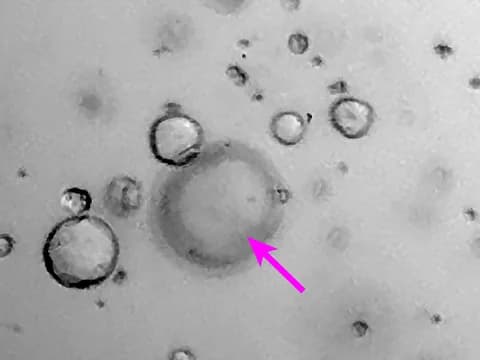
Adapted from Kassis et al. 2019 · CC BY 4.0 Setup, data and quality control
Cameras inside your incubator or in a chamber beside it, data files you can analyze, and image problems flagged.
Setup, data and quality control
Organoid models
Measures for each organoid model
Adapted from Kassis et al. 2019 · CC BY 4.0 Intestinal and colorectal organoids
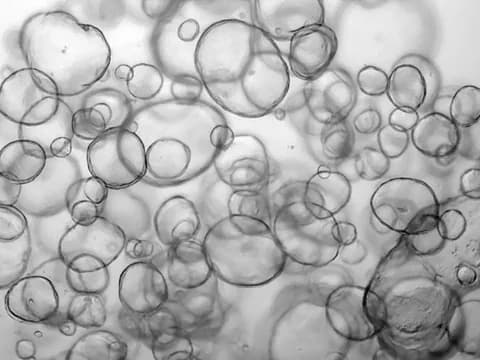
Growth, buds and lumens for each organoid, including lumens swelling after a treatment.
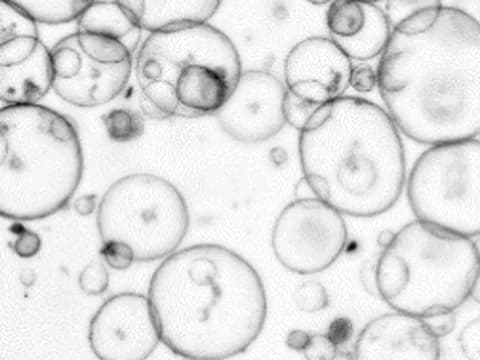
Adapted from Yu et al. 2025 · CC BY 4.0 Tumor organoids
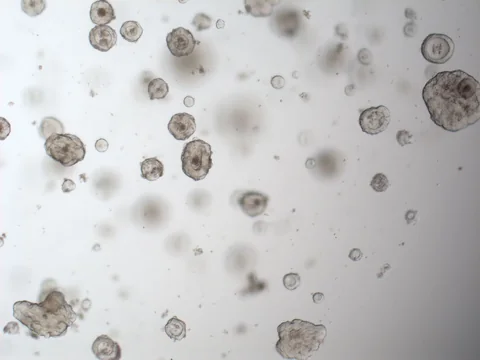
Organoid count per well, growth and regrowth for each organoid, and how responses differ within each well.
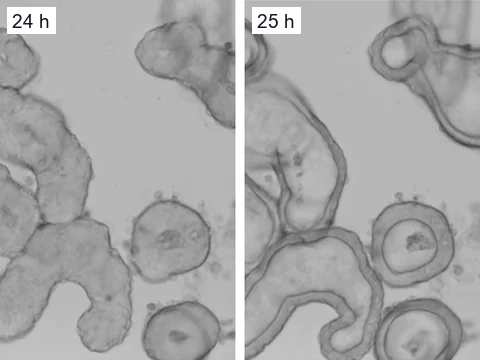
Adapted from Shamshirgaran et al. 2021 · CC BY 4.0 Kidney organoids
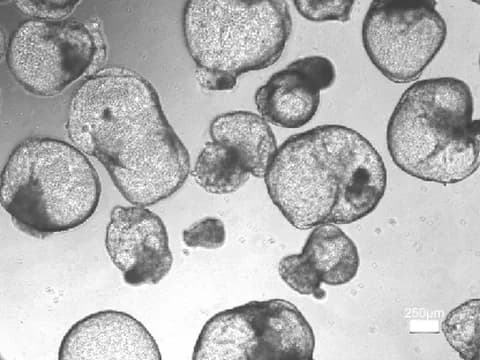
Size and shape of each organoid, and its visible cysts as they form, swell and fuse.
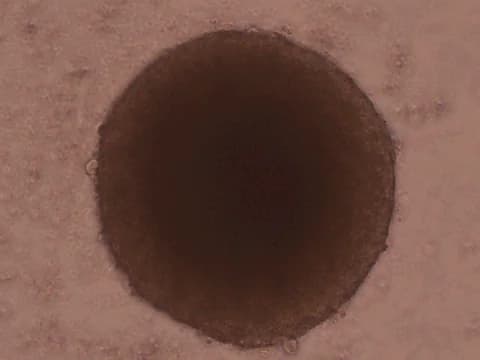
Adapted from Ivanov et al. 2014 · CC BY 4.0 Spheroids and other 3D cultures
Diameter, volume and shape of each spheroid, neurosphere or other cell aggregate, and invasion into a gel.
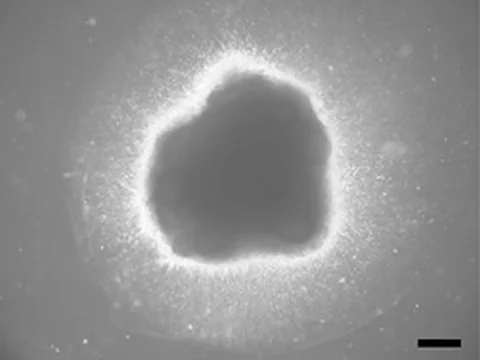
Adapted from Zang et al. 2022 · CC BY 4.0 Brain and neural organoids
Growth, outline and visible folds of each organoid, and how they change after an exposure.
Cameras
The cameras ConductScience supplies
ConductScience supplies and sets up cameras that meet these requirements for each pilot, and plans to sell them to labs.
Around the clock
- A full stack of focal planes for every well every 5 to 15 minutes, 24/7
- An image a minute of a well from the moment a large change appears until it settles, while the other wells keep their schedule
Image
- 2 µm or less per pixel
- Each organoid measured in the focal plane where it is sharpest
Light
- Brightfield LED light, on only while a picture is taken
- No dyes or labels
Incubator
- Runs inside your incubator, or in a chamber beside it that holds the same temperature, humidity and CO₂, with the lid on
- Warms the plate by less than 0.5 °C, with the temperature logged
Continuous monitoring
What continuous monitoring adds to an endpoint study
Deben and colleagues note that organoid analysis methods often measure a single time point.2 An endpoint study might add images on day 0 and day 3 before its day 7 assay. Imaging a well every 5 minutes records 2,016 time points over the same 7 days.
Hof and colleagues imaged hundreds of mouse pancreas and human bile duct cancer organoids for up to 7 days and saw lumens swell and shrink, organoids migrate and rotate, and neighbors fuse.3
Every organoid
Each organoid measured on its own
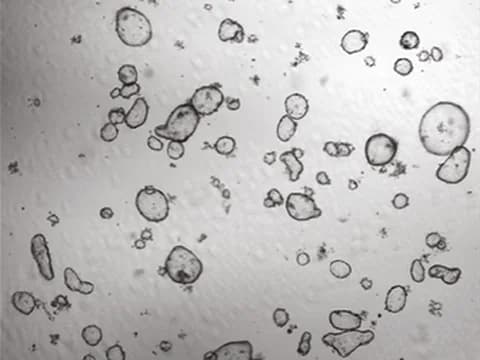
Organoids in one culture differ in size and shape.4 The authors of OrganoSeg, a published brightfield tool, note that analyses largely ignore this spread.4 Their tool profiled 5,167 breast cancer spheroids and 5,743 organoids from colorectal cancer patients' normal and tumor tissue, one by one.4
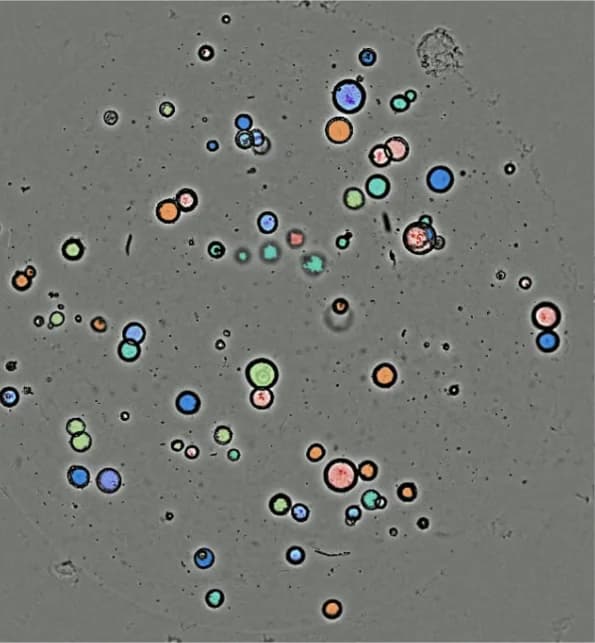
In a pilot, every organoid keeps its own record, and each well's summary shows the spread.
Camera and microscope
What a camera can see
With a camera, a pilot measures whole organoids: their size, shape, movement and visible lumens. Measurements of the cells inside an organoid need a microscope.
Pilot
How a pilot works
- 1
Tell us about your cultures
Your organoid type, plates and incubator, and the first question you want answered.
- 2
Camera setup
We set up cameras, lenses and lighting for your plates, then check which measurements the images are sharp enough for.
- 3
Monitoring
The cameras image every well around the clock. When an event starts, such as an organoid fragmenting, they image that well more often until it ends.
- 4
Results
Data files, an event log with video clips, a report, and how closely the camera's measurements matched the same organoids measured by hand by a ConductVision engineer.
Questions labs ask
Do I need a microscope?
Not for whole-organoid measurements such as size, shape, growth and movement. Measurements of individual cells need a microscope. Microscope images of 3D cultures are a separate ConductVision analysis, outside this pilot.
Where do the cameras go?
Inside your incubator, or in a chamber beside it that keeps the same conditions, depending on the incubator and your plates. The pilot checks focus, lighting and condensation before it reports any measure.
Will it tell me which organoids are dead?
Not on its own. It reports what the camera sees, such as size, shape, brightness and texture. A pilot adds a label such as dead or viable only after checking it against your own assay.
What does a pilot cost, and how long does it run?
Both depend on how many plates and cameras the pilot uses. Our proposal states the cost and length before any work starts.
Who keeps the images and data?
Your lab keeps its images and data. Each pilot starts with a written plan for storage, access and deletion.
References
- Matthews JM, Schuster B, Kashaf SS, et al. (2022). OrganoID: A versatile deep learning platform for tracking and analysis of single-organoid dynamics. PLOS Computational Biology.
- Deben C, De La Hoz EC, Compte ML, et al. (2023). OrBITS: label-free and time-lapse monitoring of patient derived organoids for advanced drug screening. Cellular Oncology.
- Hof L, Moreth T, Koch M, et al. (2021). Long-term live imaging and multiscale analysis identify heterogeneity and core principles of epithelial organoid morphogenesis. BMC Biology.
- Borten MA, Bajikar SS, Sasaki N, et al. (2018). Automated brightfield morphometry of 3D organoid populations by OrganoSeg. Scientific Reports.
- Ly VT, Baudin PV, Pansodtee P, et al. (2021). Picroscope: low-cost system for simultaneous longitudinal biological imaging. Communications Biology.
- Gulieva RE, Ahmadvand P, Freedman BS (2025). A novel rapalog shows improved safety vs. efficacy in a human organoid model of polycystic kidney disease. Stem Cell Reports.
- Yu H, Lin C, Chen F, et al. (2025). Dose response test of patient-derived cancer organoids to irradiation. Frontiers in Oncology.
- Pierzchalska M, Panek M, Grabacka M (2019). The migration and fusion events related to ROCK activity strongly influence the morphology of chicken embryo intestinal organoids. Protoplasma.
- Rohe J, Ashraf APK, Kehl M, et al. (2026). Modelling kidney cystogenesis using human kidney tubuloid cultures. BMC Molecular and Cell Biology.
- Kassis T, Hernandez-Gordillo V, Langer R, et al. (2019). OrgaQuant: Human Intestinal Organoid Localization and Quantification Using Deep Convolutional Neural Networks. Scientific Reports.
- Shamshirgaran Y, Jonebring A, Svensson A, et al. (2021). Rapid target validation in a Cas9-inducible hiPSC derived kidney model. Scientific Reports.
- Ivanov DP, Parker TL, Walker DA, et al. (2014). Multiplexing Spheroid Volume, Resazurin and Acid Phosphatase Viability Assays for High-Throughput Screening of Tumour Spheroids and Stem Cell Neurospheres. PLOS ONE.
- Zang Z, Yin H, Du Z, et al. (2022). Valproic acid exposure decreases neurogenic potential of outer radial glia in human brain organoids. Frontiers in Molecular Neuroscience.
- Lefferts JW, Kroes S, Smith MB, et al. (2024). OrgaSegment: deep-learning based organoid segmentation to quantify CFTR dependent fluid secretion. Communications Biology.
Plan an organoid monitoring pilot
Tell us your organoid type, your plates and the first question you want answered.