ConductVision Organoid Monitor
Tumor organoids, monitored 24/7
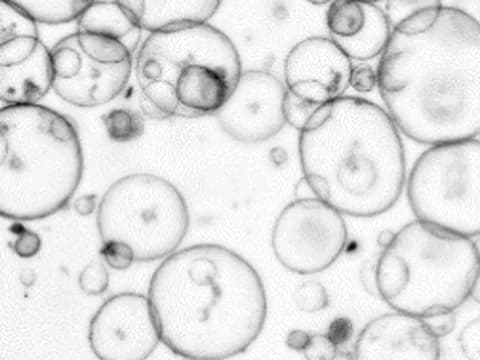
In a pilot, ConductVision counts your tumor organoids and follows each one's growth, growth arrest and regrowth, from images taken every 5 to 15 minutes.
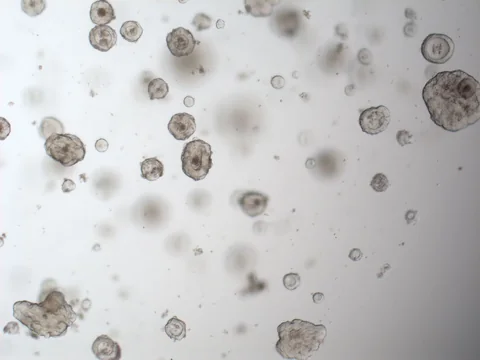
24/7 monitoring
What a pilot records for each tumor organoid
ConductVision records each measure for every visible organoid, keyed by plate, well, organoid ID and time.
| Measure | What it shows | How often |
|---|---|---|
| Every organoid | ||
| Area | 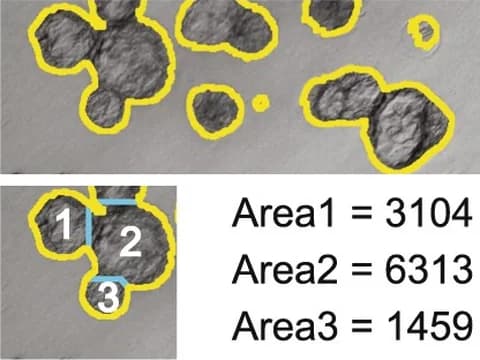 The projected area of each organoid, with its longest and shortest diameters | Every 5 to 15 minutes |
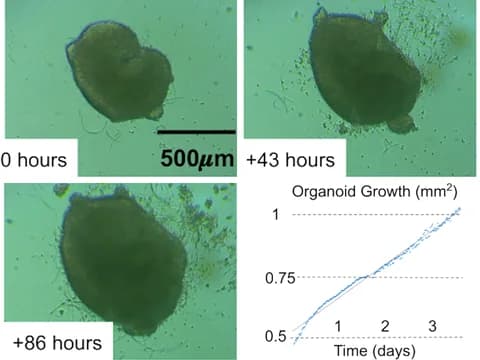
| Growth rate | 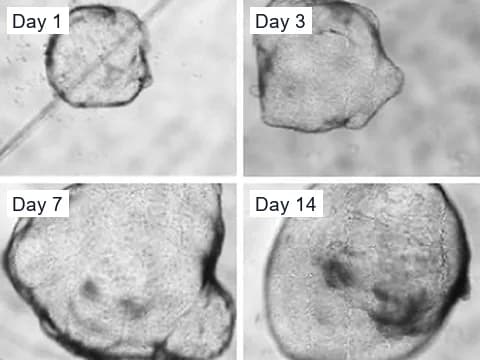 How fast each organoid grows or shrinks, per hour and per day | Every 5 to 15 minutes |
| Shape | 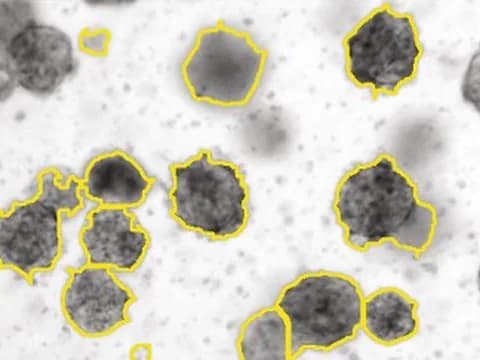 How round, long or irregular each outline is | Every 5 to 15 minutes |
| Movement | 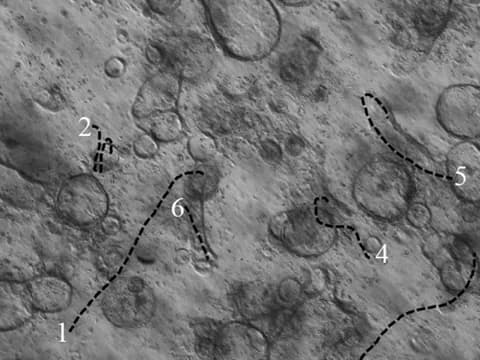 How far and how fast each organoid moves, where organoids are free to move | Every 5 to 15 minutes |
| Fusion | 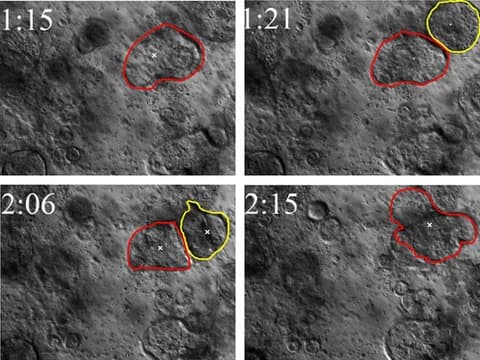 Two organoids joining into one, with both parent IDs kept | Each time it happens |
| Fragmentation | 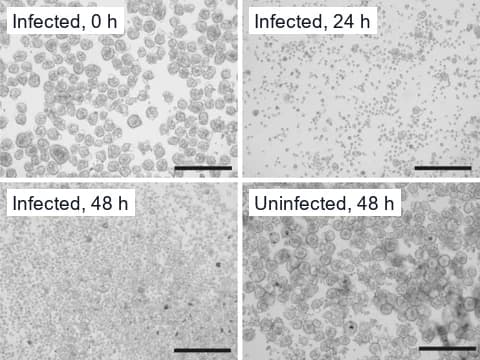 Organoids splitting or shedding pieces, each piece keeping its parent ID | Each time it happens |
| Structural collapse | 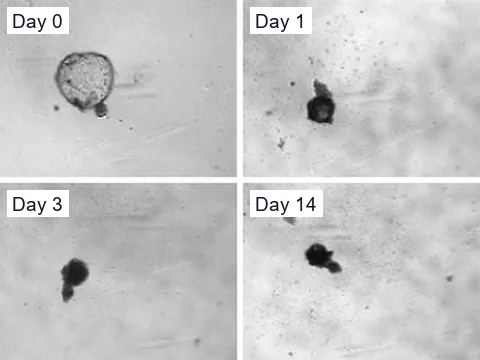 A sudden loss of area, roundness or boundary, with a clip of the change | Each time it happens |
| Tumor organoids | ||
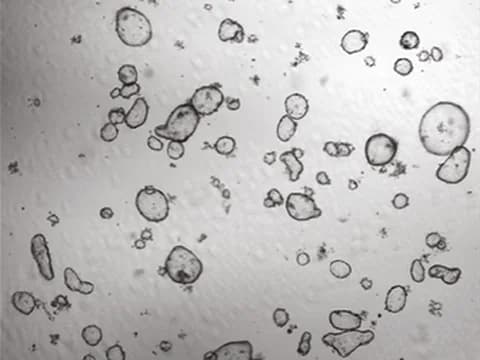
| Count | 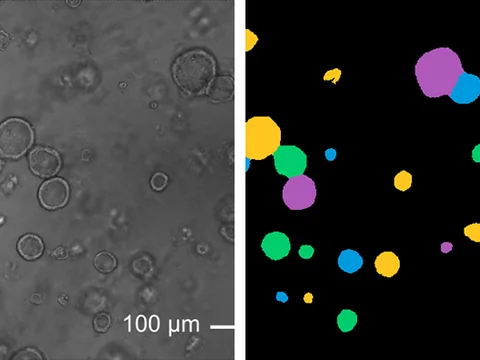 How many visible organoids each well holds, as they form, fuse and break up | Every 5 to 15 minutes |
| Treatment response | 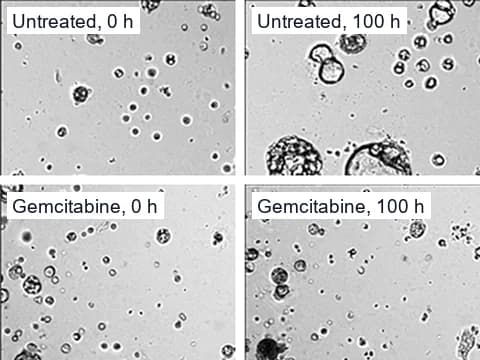 Growth arrest, shrinkage and response latency after a treatment, normalized to each organoid's own baseline and your controls | Every 5 to 15 minutes |
| Regression and regrowth | 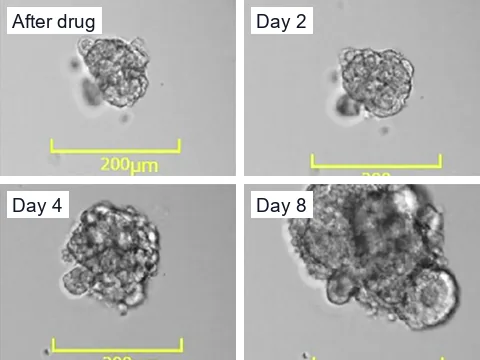 Regression, regrowth and recurrent growth after a first response | Every 5 to 15 minutes |
| Protrusions and gross invasion | 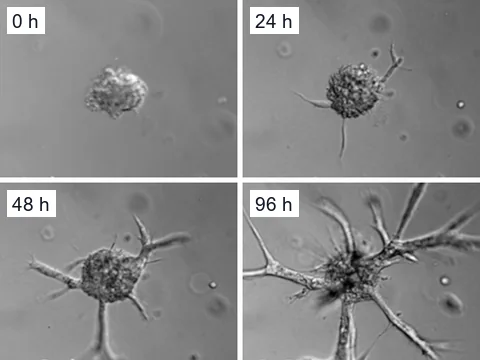 Large protrusions, and gross invasion into the surrounding gel, where the camera resolves them | Every 5 to 15 minutes |
| Differences between organoids | 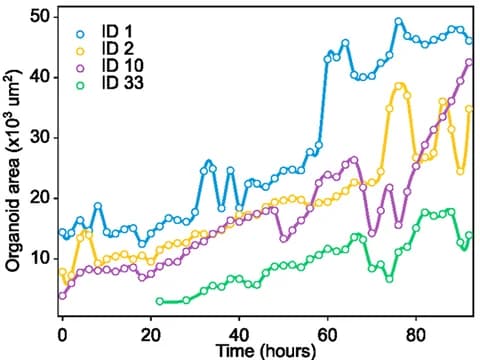 The share of organoids growing, stable and shrinking in each well, beside the well average | Every 5 to 15 minutes |
When a fusion, fragmentation or structural collapse begins, the camera images that well every minute until the change ends. Fragmentation and structural collapse describe what the camera sees in each organoid's outline, not whether its cells are alive.
Beyond the camera
What needs higher magnification or a dye
- Individual cells
- Cell division (mitosis)
- Single cells invading the gel
- Molecular markers
Evidence
What published studies found in tumor organoids
Other research groups measured these in microscope images of patient-derived organoids.
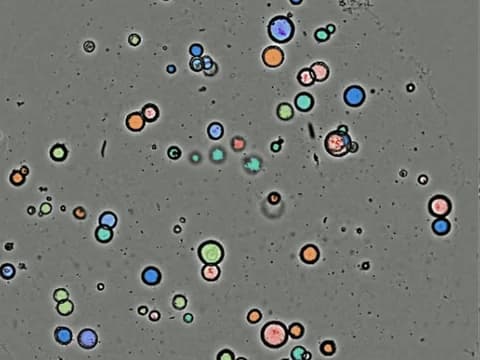
Count and area without dyes
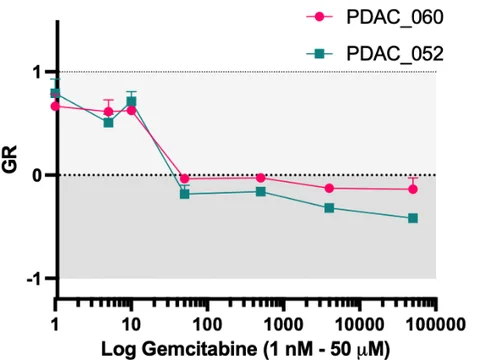
Growth rate
Deben and colleagues, whose OrBITS study included two genetically validated pancreatic cancer organoid lines, advise a growth rate-based metric to measure organoid drug responses more accurately and consistently.1
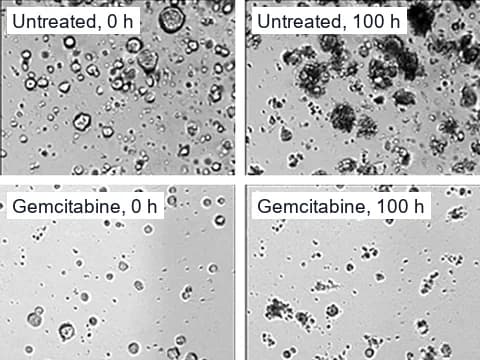
Stalled or shrinking organoids
To tell cytostatic from cytotoxic responses, Deben and colleagues added a fluorescent dye that marks damaged cells to their brightfield imaging.1 A pilot uses no dyes, so it reports when an organoid stalls, shrinks, fragments or collapses, but cannot say whether the drug stopped its growth or killed it.
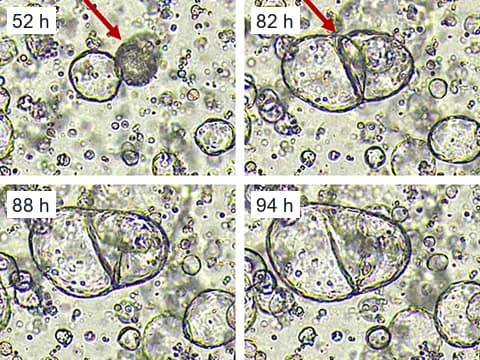
Fusion
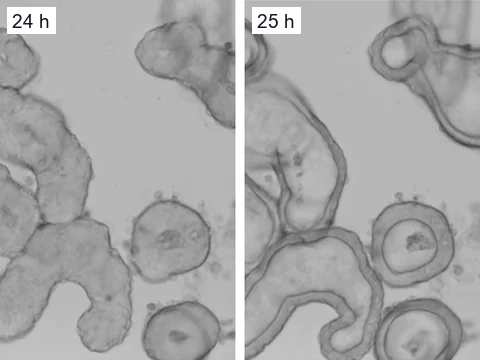
In OrBITS time-lapses, organoid counts dropped over time as organoids merged or fused.1 A pilot gives each fused organoid a new ID that records both parents, so the count stays traceable.
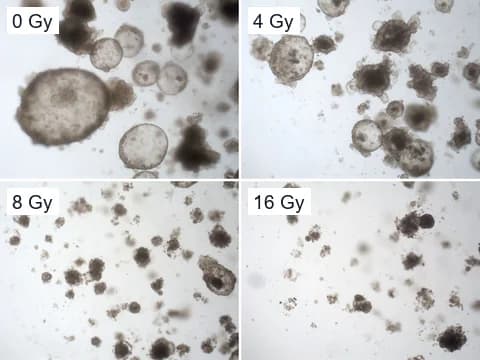
Structure scored by an observer
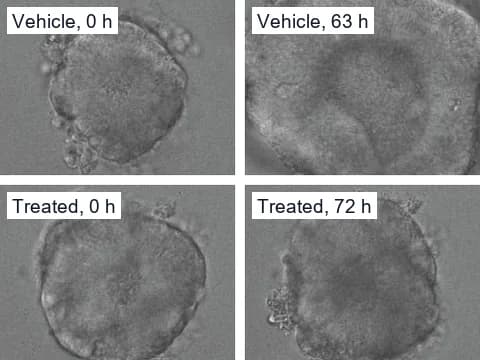
Label-free drug responses
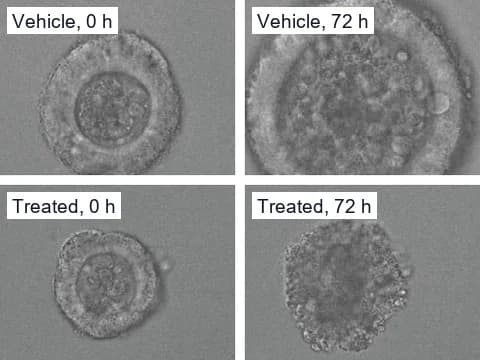
Each organoid's response
Spiller and colleagues tracked how individual patient-derived tumor organoids responded to drugs, in brightfield images taken at several time points without vital dyes.4
Camera specification
The cameras a pilot uses
Around the clock
- A full stack of focal planes for every well, every 5 to 15 minutes
Incubator
- Inside your incubator, or in a chamber beside it that keeps the same conditions
References
- Deben C, De La Hoz EC, Compte ML, et al. (2023). OrBITS: label-free and time-lapse monitoring of patient derived organoids for advanced drug screening. Cellular Oncology.
- Yu H, Lin C, Chen F, et al. (2025). Dose response test of patient-derived cancer organoids to irradiation. Frontiers in Oncology.
- Larsen BM, Kannan M, Langer LF, et al. (2021). A pan-cancer organoid platform for precision medicine. Cell Reports.
- Spiller ER, Ung N, Kim S, et al. (2021). Imaging-Based Machine Learning Analysis of Patient-Derived Tumor Organoid Drug Response. Frontiers in Oncology.
- Borten MA, Bajikar SS, Sasaki N, et al. (2018). Automated brightfield morphometry of 3D organoid populations by OrganoSeg. Scientific Reports.
- Gulieva RE, Ahmadvand P, Freedman BS (2025). A novel rapalog shows improved safety vs. efficacy in a human organoid model of polycystic kidney disease. Stem Cell Reports.
- Pierzchalska M, Panek M, Grabacka M (2019). The migration and fusion events related to ROCK activity strongly influence the morphology of chicken embryo intestinal organoids. Protoplasma.
- Stroulios G, Brown T, Moreni G, et al. (2022). Apical-out airway organoids as a platform for studying viral infections and screening for antiviral drugs. Scientific Reports.
- Matthews JM, Schuster B, Kashaf SS, et al. (2022). OrganoID: A versatile deep learning platform for tracking and analysis of single-organoid dynamics. PLOS Computational Biology.
- Ferreira N, Kulkarni A, Agorku D, et al. (2024). OrganoIDNet: a deep learning tool for identification of therapeutic effects in PDAC organoid-PBMC co-cultures from time-resolved imaging data. Cellular Oncology.
- Nakano K, Oki E, Yamazaki M, et al. (2025). Colorectal cancer cell line-derived organoid model with stem cell properties captures the regrowing state of residual cancer cells after neoadjuvant chemotherapy. Cell Death Discovery.
- Gavin C, Geerts N, Cavanagh B, et al. (2021). Neuroblastoma Invasion Strategies Are Regulated by the Extracellular Matrix. Cancers.
- Yan H, Wu T, Li X, et al. (2024). Establishment of the microscope incubation system and its application in evaluating tumor treatment effects through real-time live cellular imaging. Frontiers in Bioengineering and Biotechnology.
- Verissimo CS, Overmeer RM, Ponsioen B, et al. (2016). Targeting mutant RAS in patient-derived colorectal cancer organoids by combinatorial drug screening. eLife.
- Lefferts JW, Kroes S, Smith MB, et al. (2024). OrgaSegment: deep-learning based organoid segmentation to quantify CFTR dependent fluid secretion. Communications Biology.
- Hof L, Moreth T, Koch M, et al. (2021). Long-term live imaging and multiscale analysis identify heterogeneity and core principles of epithelial organoid morphogenesis. BMC Biology.
- Ly VT, Baudin PV, Pansodtee P, et al. (2021). Picroscope: low-cost system for simultaneous longitudinal biological imaging. Communications Biology.
Plan a tumor organoid pilot
Tell us about your tumor organoids, your plates, your treatments and the response you want timed.