ConductVision Organoid Monitor
Spheroids and 3D cultures, monitored 24/7
In a pilot, ConductVision measures the diameter, volume and shape of each spheroid or other 3D culture, from images taken every 5 to 15 minutes.
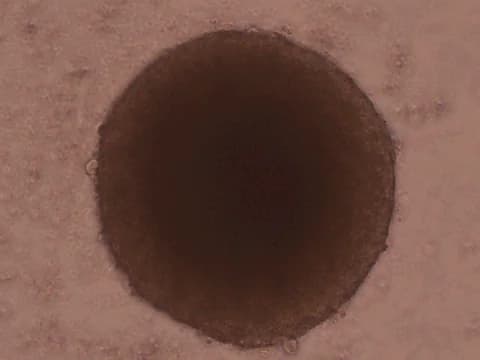
24/7 monitoring
What a pilot records for each spheroid or 3D culture
ConductVision records each measure for every visible spheroid, keyed by plate, well, spheroid ID and time. A pilot applies the same measures to other 3D cultures, such as neurospheres, embryoid bodies, cell aggregates and assembloids.
| Measure | What it shows | How often |
|---|---|---|
| Every spheroid | ||
| Area | 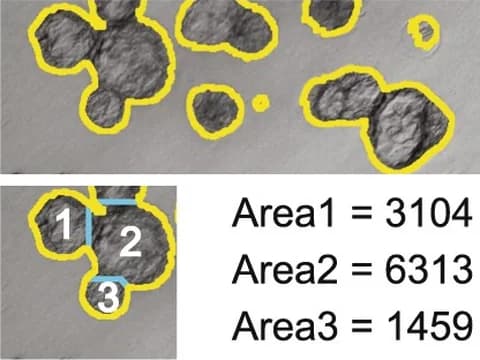 The projected area of each spheroid, with its longest and shortest diameters | Every 5 to 15 minutes |
| Growth rate | 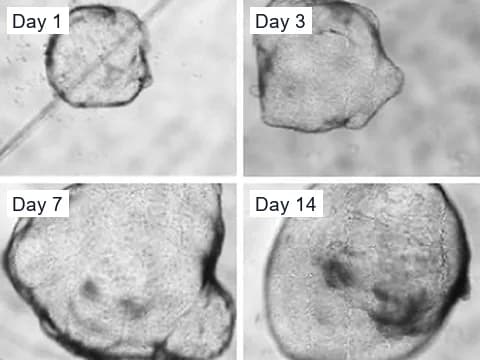 How fast each spheroid grows or shrinks, per hour and per day | Every 5 to 15 minutes |
| Shape | 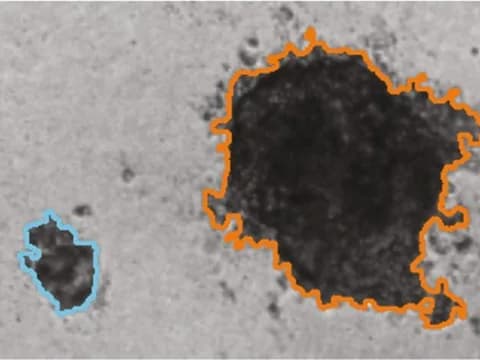 How round, long or irregular each outline is | Every 5 to 15 minutes |
| Movement | 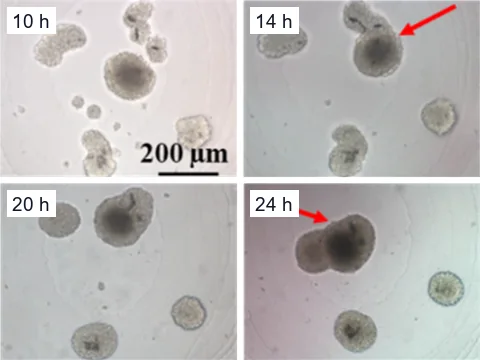 How far and how fast each spheroid moves, in wells with several spheroids free to move | Every 5 to 15 minutes |
| Fusion | 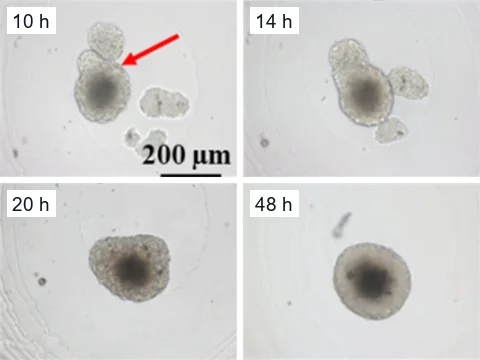 Two spheroids joining into one in wells with several spheroids, with both parent IDs kept | Each time it happens |
| Fragmentation | 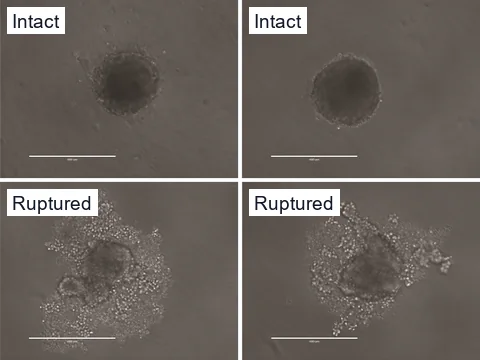 Spheroids splitting or shedding pieces, each piece keeping its parent ID | Each time it happens |
| Structural collapse | 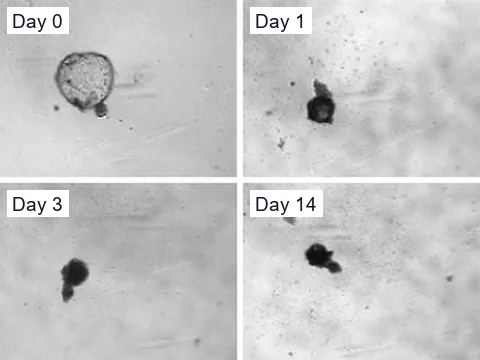 A sudden loss of area, roundness or boundary, with a clip of the change | Each time it happens |
| Spheroids and other 3D cultures | ||
| Volume | 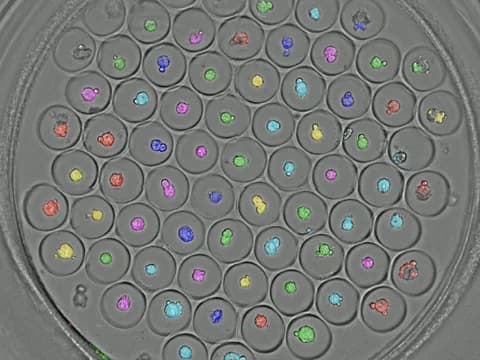 A volume estimate from the outline, where the spheroid is round | Every 5 to 15 minutes |
| Center and edge | 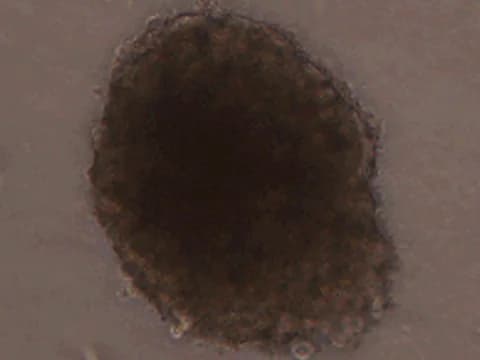 Differences between the center and the edge of each spheroid, in brightness and texture | Every 5 to 15 minutes |
| Invasion into gel | 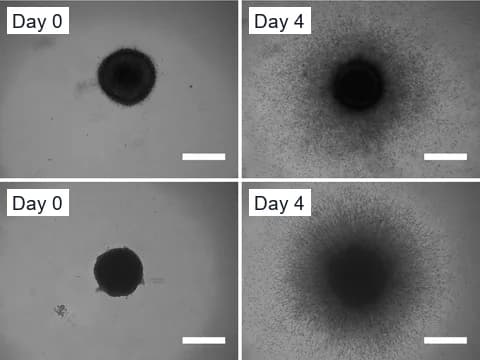 How far each spheroid spreads into a surrounding gel, for spheroids embedded in one | Every 5 to 15 minutes |
| Treatment response | 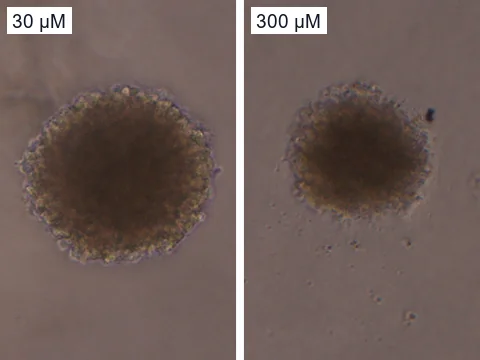 Response latency, growth arrest, shrinkage and recovery after a treatment, against untreated and vehicle controls | Every 5 to 15 minutes |
When a fusion, fragmentation or structural collapse begins, the camera images that well every minute until the change ends. Fragmentation and structural collapse describe what the camera sees in each spheroid's outline, not whether its cells are alive.
Beyond the camera
What needs higher magnification or a dye
- Individual cells
- How single cells move
- Structures inside cells
Evidence
What published studies found in spheroids
Other research groups measured these in images of tumor spheroids and neurospheres from microscopes and plate imagers.
Volume
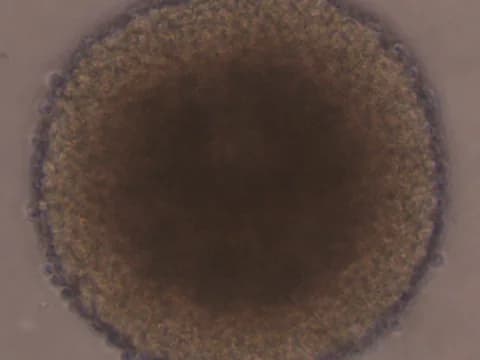
Ivanov and colleagues measured spheroid volume from images in ultra-low attachment 96-well plates, using an automated ImageJ macro.1 In healthy spheroids 160 to 800 µm across, volume correlated with the number of healthy cells.1 Combining volume with resazurin and phosphatase assays gave a richer picture of spheroid condition.1
Size at scale
Growth and invasion
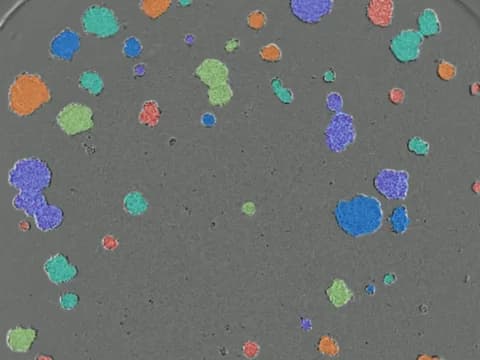
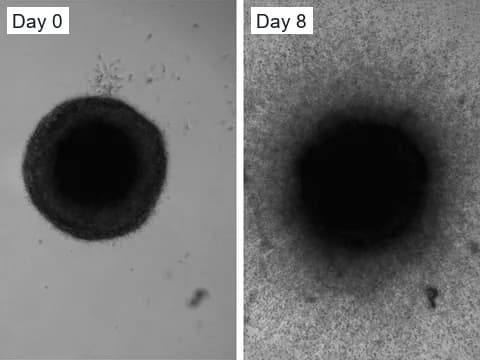
A Celigo plate imager scanned a 96-well plate in 8 minutes and measured each spheroid's diameter, perimeter and area.3 The same automated analysis followed tumor spheroids invading the surrounding matrix for up to 72 hours, with effects of a test compound visible after 24 hours.3 A pilot images each well around the clock, inside your incubator or in a chamber beside it, and compares every spheroid with its own start.
Treated spheroids
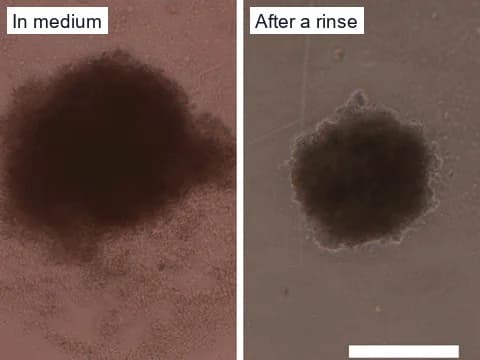
In Ivanov and colleagues' etoposide series, a halo of debris formed around intact spheroids at high doses and got in the way of image analysis.1
Camera specification
The cameras a pilot uses
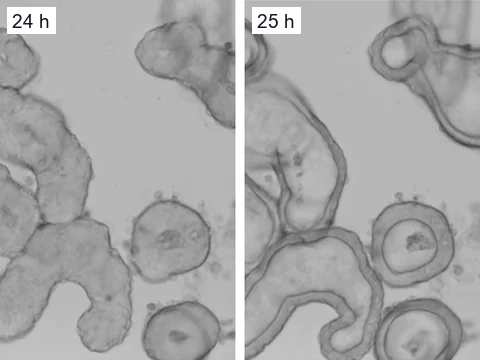
Around the clock
- A full stack of focal planes for every well, every 5 to 15 minutes
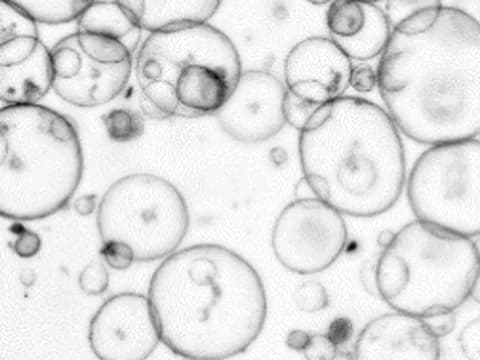
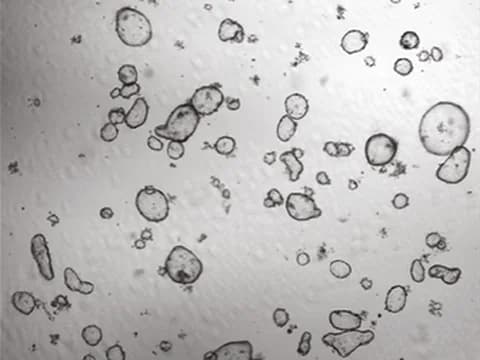
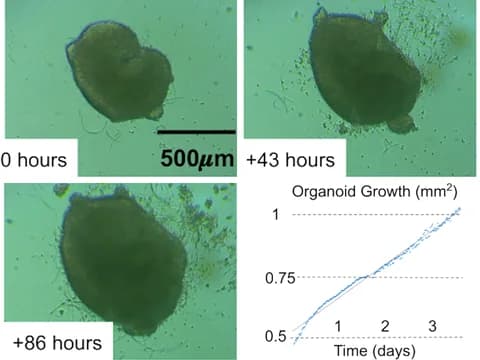
Incubator
- Inside your incubator, or in a chamber beside it that keeps the same conditions
References
- Ivanov DP, Parker TL, Walker DA, et al. (2014). Multiplexing Spheroid Volume, Resazurin and Acid Phosphatase Viability Assays for High-Throughput Screening of Tumour Spheroids and Stem Cell Neurospheres. PLOS ONE.
- Chen W, Wong C, Vosburgh E, et al. (2014). High-throughput Image Analysis of Tumor Spheroids: A User-friendly Software Application to Measure the Size of Spheroids Automatically and Accurately. Journal of Visualized Experiments.
- Vinci M, Gowan S, Boxall F, et al. (2012). Advances in establishment and analysis of three-dimensional tumor spheroid-based functional assays for target validation and drug evaluation. BMC Biology.
- Borten MA, Bajikar SS, Sasaki N, et al. (2018). Automated brightfield morphometry of 3D organoid populations by OrganoSeg. Scientific Reports.
- Gulieva RE, Ahmadvand P, Freedman BS (2025). A novel rapalog shows improved safety vs. efficacy in a human organoid model of polycystic kidney disease. Stem Cell Reports.
- Pan R, Yang X, Ning K, et al. (2023). Recapitulating the Drifting and Fusion of Two-Generation Spheroids on Concave Agarose Microwells. International Journal of Molecular Sciences.
- McRobb LS, Lee VS, Faqihi F, et al. (2024). A Simple Model to Study Mosaic Gene Expression in 3D Endothelial Spheroids. Journal of Cardiovascular Development and Disease.
- Deben C, De La Hoz EC, Compte ML, et al. (2023). OrBITS: label-free and time-lapse monitoring of patient derived organoids for advanced drug screening. Cellular Oncology.
- Cisneros Castillo LR, Oancea AD, Stüllein C, et al. (2016). A Novel Computer-Assisted Approach to evaluate Multicellular Tumor Spheroid Invasion Assay. Scientific Reports.
- Lefferts JW, Kroes S, Smith MB, et al. (2024). OrgaSegment: deep-learning based organoid segmentation to quantify CFTR dependent fluid secretion. Communications Biology.
- Hof L, Moreth T, Koch M, et al. (2021). Long-term live imaging and multiscale analysis identify heterogeneity and core principles of epithelial organoid morphogenesis. BMC Biology.
- Ly VT, Baudin PV, Pansodtee P, et al. (2021). Picroscope: low-cost system for simultaneous longitudinal biological imaging. Communications Biology.
Plan a spheroid pilot
Tell us about your spheroids or other 3D cultures, your plates and the first question you want answered.