ConductVision Organoid Monitor
When a treatment acts, organoid by organoid
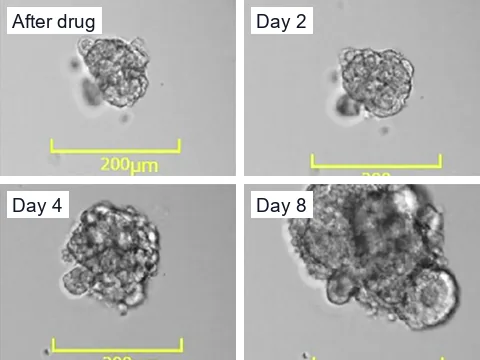
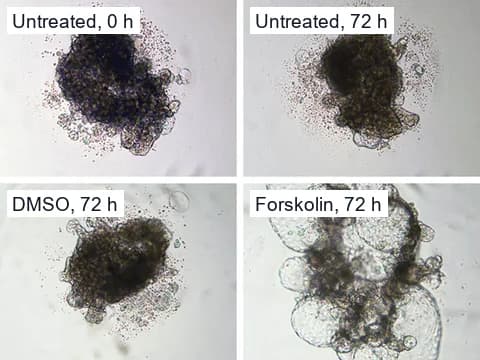
A pilot compares each organoid's growth and shape before and after treatment, against your controls, and shows which organoids slow, stop or keep growing.
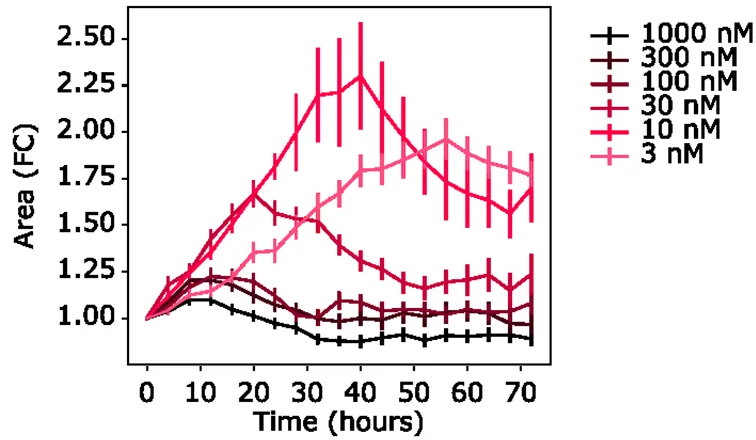
Measures
What a pilot measures around each treatment
You enter each treatment time by hand, or import the times from your protocol.
Response
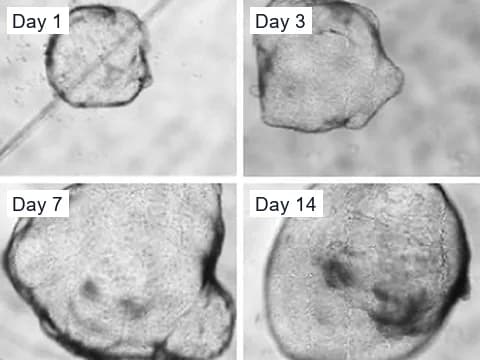
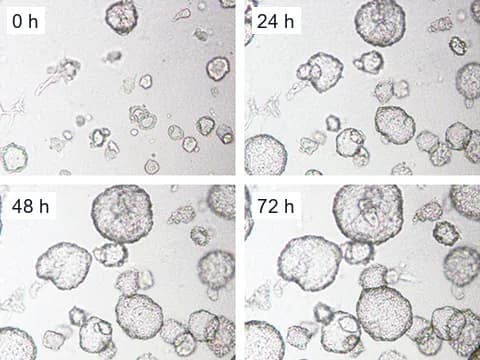
- How soon a response starts
- The largest effect
- Change in growth rate, shape and movement
Timing
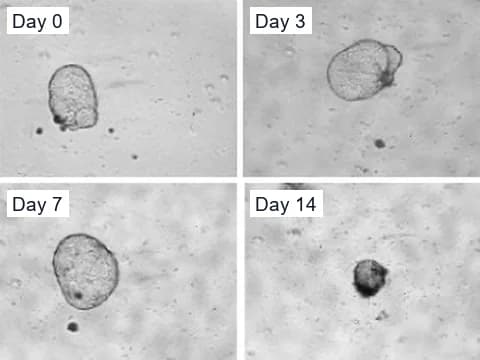
- Time to growth arrest
- Time to shrinkage
- Time to fragmentation
Afterward
- Recovery, regrowth and rebound
- Whether the response lasts or passes
Comparisons
- Each organoid against its own baseline
- Untreated and vehicle controls
- Other doses and treatments
- The whole population
Timing
The time course an endpoint assay leaves out
Deben and colleagues used OrBITS, their brightfield time-lapse tool, to track organoids through a drug screen, and advise judging drug response by growth rate.1 With a fluorescent dye that marks damaged cells added, their time course also told cytostatic from cytotoxic responses, which the CellTiter-Glo 3D endpoint assay could not.1
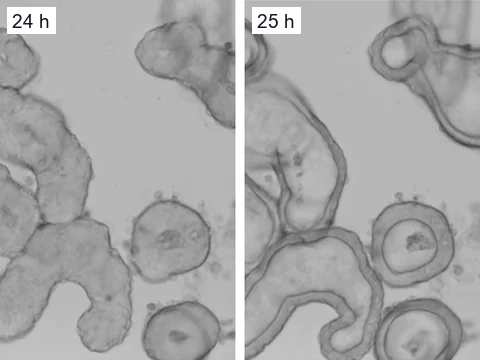
Spiller and colleagues followed the drug responses of individual tumor organoids in brightfield images taken at several time points, without dyes.2 With continuous imaging, the first change after a treatment gets a time stamp.
Spread
Spread of responses across organoids
Spiller and colleagues note that organoids differ in size, cell makeup and response over time, which makes 3D cultures hard to evaluate.2 When Jabs and colleagues screened the same ovarian cancer cells as flat cultures and as organoids, drug effects were more diverse in the organoids.3
Borten and colleagues note that analyses largely ignore the spread of size and shape within a culture.4 A pilot reports the share of organoids growing, stable and shrinking in each well, alongside the well average.
Camera specification
The camera a treatment study needs
A treatment study compares each organoid with itself, so every image must be taken the same way.
Timing
- A full stack of every well every 5 to 15 minutes before and after treatment
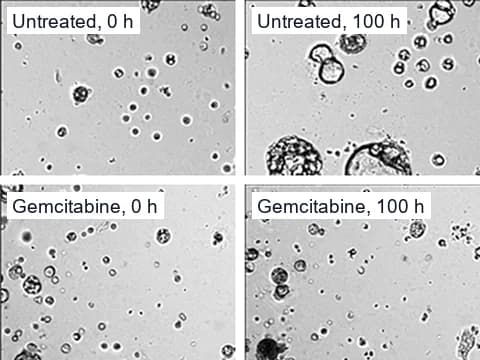
OrganoID's gemcitabine study imaged organoids every 4 hours over 72 hours.5 Imaging every 5 to 15 minutes dates the first response to a treatment more closely.
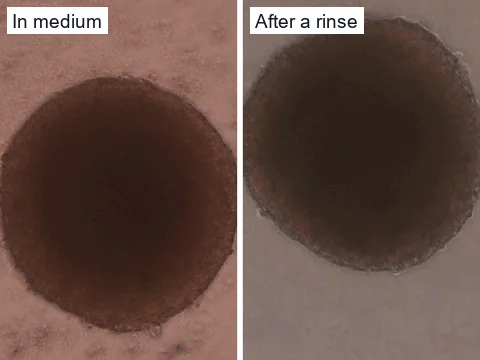
Light
- The same light and exposure for the whole study
- Each image normalized to its own background, so a change in medium color does not read as a response
Fixed settings keep images from before and after a treatment comparable.
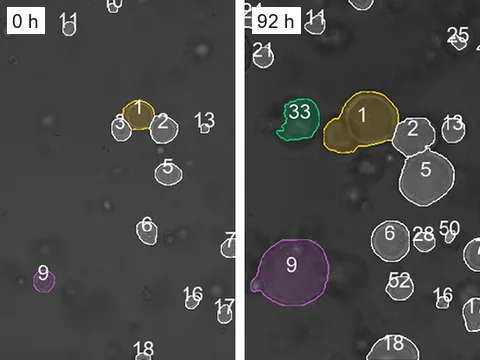
Position
- A plate holder that puts each well back under its camera after dosing
- Each new image aligned to the one before it
- Images flagged until the plate has warmed back up and stopped drifting
Alignment keeps each organoid matched to its own record after the plate goes back in.
Deliverables
What the pilot delivers
- Response curves for every organoid and condition
- Time-to-event tables for arrest, shrinkage and fragmentation
- The spread of responses in each well
- Clips of organoids that responded unlike their neighbors
References
- Deben C, De La Hoz EC, Compte ML, et al. (2023). OrBITS: label-free and time-lapse monitoring of patient derived organoids for advanced drug screening. Cellular Oncology.
- Spiller ER, Ung N, Kim S, et al. (2021). Imaging-Based Machine Learning Analysis of Patient-Derived Tumor Organoid Drug Response. Frontiers in Oncology.
- Jabs J, Zickgraf FM, Park J, et al. (2017). Screening drug effects in patient-derived cancer cells links organoid responses to genome alterations. Molecular Systems Biology.
- Borten MA, Bajikar SS, Sasaki N, et al. (2018). Automated brightfield morphometry of 3D organoid populations by OrganoSeg. Scientific Reports.
- Matthews JM, Schuster B, Kashaf SS, et al. (2022). OrganoID: A versatile deep learning platform for tracking and analysis of single-organoid dynamics. PLOS Computational Biology.
- Gulieva RE, Ahmadvand P, Freedman BS (2025). A novel rapalog shows improved safety vs. efficacy in a human organoid model of polycystic kidney disease. Stem Cell Reports.
- Rohe J, Ashraf APK, Kehl M, et al. (2026). Modelling kidney cystogenesis using human kidney tubuloid cultures. BMC Molecular and Cell Biology.
- Nakano K, Oki E, Yamazaki M, et al. (2025). Colorectal cancer cell line-derived organoid model with stem cell properties captures the regrowing state of residual cancer cells after neoadjuvant chemotherapy. Cell Death Discovery.
- Ferreira N, Kulkarni A, Agorku D, et al. (2024). OrganoIDNet: a deep learning tool for identification of therapeutic effects in PDAC organoid-PBMC co-cultures from time-resolved imaging data. Cellular Oncology.
- Lefferts JW, Kroes S, Smith MB, et al. (2024). OrgaSegment: deep-learning based organoid segmentation to quantify CFTR dependent fluid secretion. Communications Biology.
- Ivanov DP, Parker TL, Walker DA, et al. (2014). Multiplexing Spheroid Volume, Resazurin and Acid Phosphatase Viability Assays for High-Throughput Screening of Tumour Spheroids and Stem Cell Neurospheres. PLOS ONE.
Measure treatment response in a pilot
Tell us your organoid type, your treatments and the response you want timed.