Live/Dead Cell Viability
Dual-fluorescence viability assessment
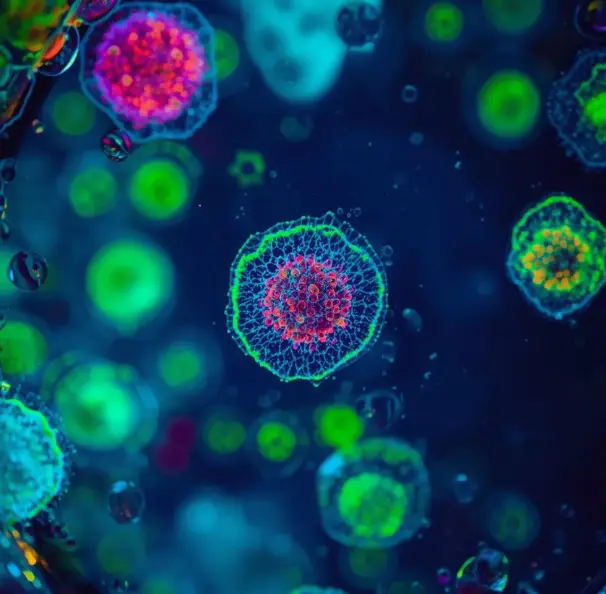
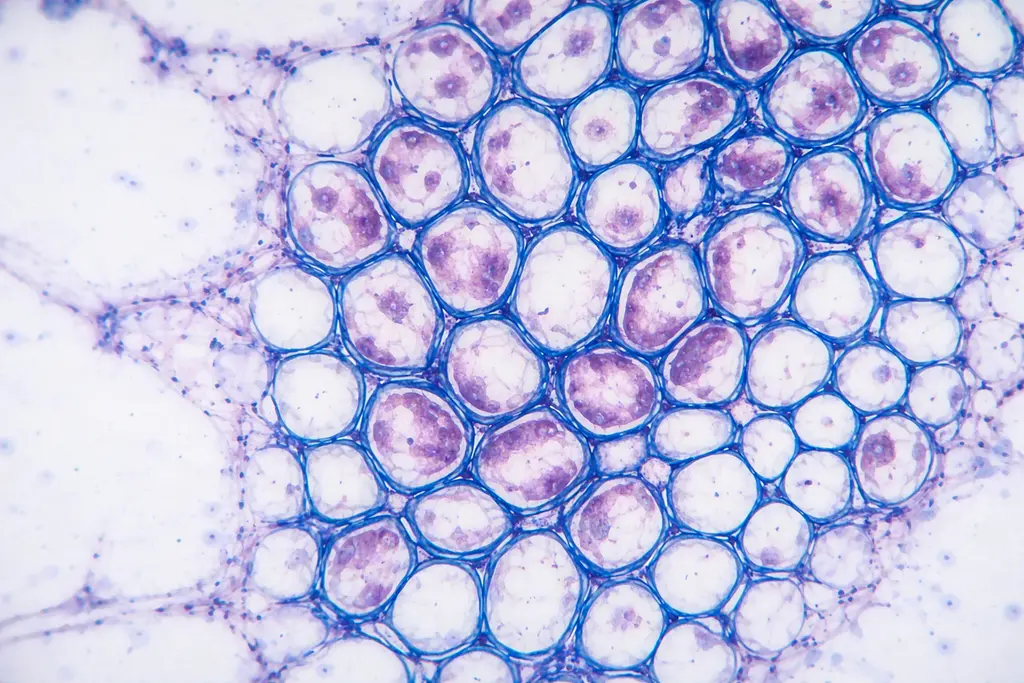
Assess cell viability using dual-fluorescence live/dead staining assays. ConductVision simultaneously detects calcein AM (live) and ethidium homodimer (dead) signals, calculating viability percentages with automatic background correction and debris exclusion.

How It Works
Upload
Load dual-channel fluorescence images
Classify
AI separates live from dead signals
Calculate
Compute viability percentages per field
Export
Download viability ratios and cell-by-cell classifications
What You Get
Dual-Channel Classification
Simultaneously process green (live) and red (dead) channels with automatic spectral separation
Debris Exclusion
AI distinguishes real cells from fluorescent debris, staining artifacts, and autofluorescence
Dose-Response Ready
Output structured for direct import into dose-response curve fitting tools like GraphPad Prism
Works With Your Existing Tools
Related biology applications
Use these Life Science pages when the same image-analysis method needs to be evaluated in the context of an assay, marker panel, plate workflow, or biological endpoint.

Ready to standardize your Live/Dead Cell Viability workflow?
Upload your first image and get results in under 60 seconds.
Try ConductVision