Nineteen pre-built workflows for image quantification
From fluorescence cell counts to ASTM E112 grain size, every ConductVision Image protocol uses the same AI segmentation engine — reproducible across batches, exportable to your tools, locked for your team.

19
Pre-Built Workflows
99.2%
Detection Precision
92.7%
Cell Recall
<2 min
Per Image
Life Science Applications
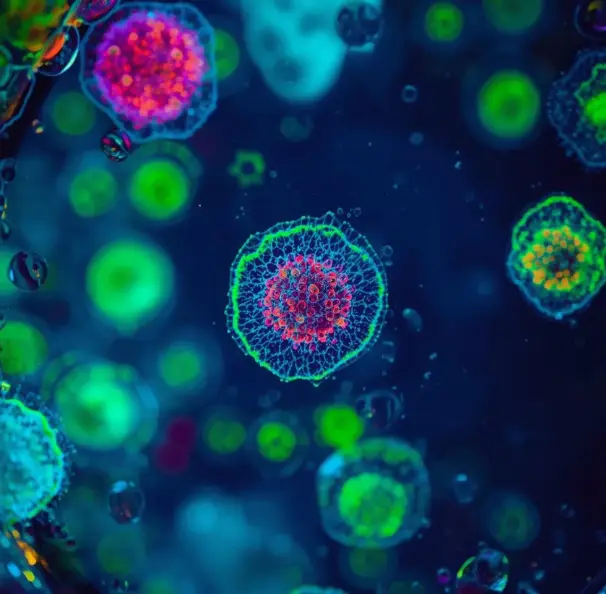
Cell Count (Fluorescence)
Automated DAPI / GFP / mCherry counts — AI handles overlapping nuclei and intensity variation without manual thresholding.

Cell Confluence
Quantify monolayer coverage from phase-contrast or brightfield images — no fluorescent labels, real-time monitoring across 96-well plates.

Nuclei (Fluorescence)
Watershed-enhanced AI separates touching DAPI / Hoechst nuclei and measures area, intensity, and morphology at scale.

Hematoxylin-Stained Nuclei
Color deconvolution + tissue-aware AI detect nuclei in H&E sections, generating density maps across whole-slide ROIs.

DAB Stained Tissue
Automated H-score from DAB-positive area and optical density — eliminates subjective manual IHC scoring.

Live/Dead Viability
Dual-channel calcein AM / ethidium homodimer classification with automatic debris exclusion and viability ratios.

Object Count (General)
Scale-agnostic detection from bacterial colonies to macroscopic particles with size and shape filtering.

Colony Counting Software
Count colonies from uploaded agar plate images or folders with AI segmentation, colony locations, overlays, and distribution analysis.
Percent Area (General)
Adaptive thresholding measures positive area fraction for tissue staining, surface coverage, or contamination assessment.
Purpose-built pipelines for organoids, foci, and screening
Beyond generic counting, the same AI engine runs assay-specific pipelines: phenotype 3D organoids by shape, count intranuclear foci per cell, and scale either across a full screening plate. For neurite and axon tracing, see ConductVision Trace.
Organoid & Spheroid Morphology
Segment 3D cultures from label-free brightfield and profile 19 shape features, z-scored against a wildtype control.
Nuclear & RNA Foci
Count intranuclear puncta per nucleus — RNA foci, DNA-damage foci, FISH spots — with count, intensity, and area.
High-Content Screening
Run any workflow across a 5,000+ image plate and export per-well CSV ready for dose-response fitting.
Follow every cell through time, not just count it in one frame
Point ConductVision Image at a time-lapse video and the same AI detection engine links each cell frame by frame, reconstructing motility trajectories, full division and lineage trees, migration heat maps, and population dynamics. Motion, survival, and proliferation analytics a single-frame count can never show.
Cell Motility & Trajectory
Reconstruct each cell’s path across every frame: total path length, net displacement, directionality, and mean squared displacement (MSD).
Cell Division & Lineage
Full parent → daughter division trees: who divided, who survived, generation depth, branching rate, and orphan detection.
Migration Heat Maps
Spatial density of where cells dwell and migrate across the field, mapped low-to-high activity for the whole population.
Population Dynamics
Average speed, proliferation rate, and survival curves plotted frame by frame, plus forest-level lineage metrics.
Materials Science Applications

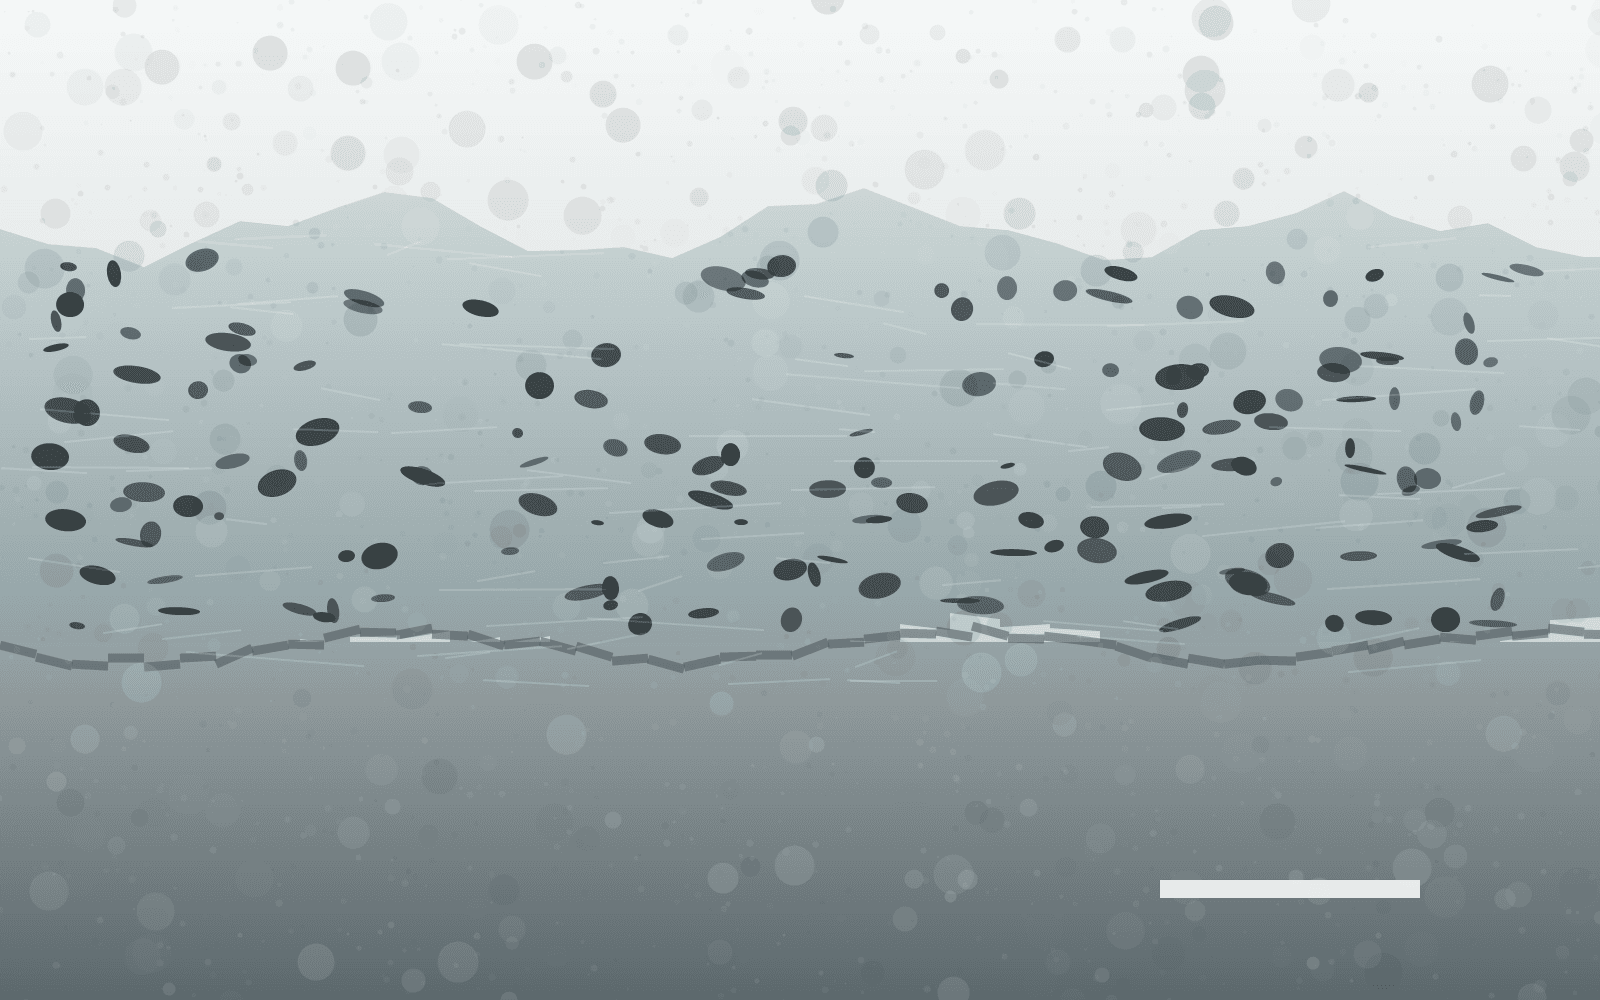
Particle Size Analysis
Image-based D10/D50/D90 distributions from microscopy or SEM — ISO 13322-1 compliant aggregate separation.

Grain Size (ASTM E112)
Planimetric, intercept, and comparison methods for ASTM E112 grain size number calculation in metallography.

Phase & Microstructure
Identify ferrite, pearlite, martensite, and bainite simultaneously using color and texture cues with phase mapping.

Defect Detection
Multi-class detection of voids, cracks, inclusions, and scratches with automated severity scoring and density maps.

Coating & Thin Film
Multi-layer thickness profiling and coverage assessment from cross-sectional microscopy with bare-spot detection.

Surface Coverage & Porosity
Pore size distributions, void fraction, and interconnectivity analysis for sintered metals, ceramics, and composites.

Fiber & Inclusion Analysis
AI traces fibers through overlapping regions and generates orientation tensors for anisotropy assessment in composites.
Coating Thickness & Porosity
Measure coating layers, black-area porosity, and Vickers indentation dimensions from cross-sectional micrographs.
Microsphere Analysis
Count, diameter, and number-weighted D10/D50/D90 with span and CV% for drug-delivery, embolization, and calibration beads.

Custom Inspection
Visual protocol editor for bespoke detection routines — build, validate, lock, and deploy across team workstations.
Configure the engine to match your sample and your scope
Three analysis modes, a microscopy type that steers AI model selection, and a dedicated microsphere sizing module. Pick the mode that fits how your cells actually look, and switch without restarting.
Analysis Modes
Object detection, segmentation, or density map. When cells are too dense to separate, the count becomes the integral of a density map.
Microscopy Compatibility
Brightfield, fluorescence, phase contrast, DIC, widefield, and two-photon. Your optics guide which AI model runs.
Microsphere Size Analysis
Count, mean and median diameter, D10 / D50 / D90, and a histogram with a fitted normal curve. Border objects excluded by default.
Four steps from image to result
Workflow
Upload
Load Your Images
- Single image or 5,000+ batch
- TIFF, PNG, JPG, CZI, ND2
- Drag-and-drop or watch-folder
Select
Pick a Workflow
- 19 pre-built protocols
- Or load a custom protocol
- Parameters lock per batch
Review
Verify Detection
- Side-by-side overlay on original
- Accept, reject, or refine
- Real-time accuracy stats
Export
Publication-Ready Output
- CSV measurements & summary stats
- Annotated images with overlays
- Auto-generated methods paragraphs
What you get with every workflow
AI-Powered Detection
Neural networks trained on diverse sample types handle overlapping objects, dim signals, and debris without manual tuning between images.
Publication-Ready Outputs
Annotated images, summary statistics, and auto-generated methods paragraphs ready to drop into manuscripts and grant reports.
Batch Processing at Scale
Process entire 96-well plate experiments or hundreds of metallographic fields in one run with parameters locked across the batch.
Standards Compliance
Workflows align with ASTM E112 (grain size), ISO 13322-1 (particle sizing), and other community standards for traceable results.
Multi-Channel & Multi-Phase
Combine fluorescence channels, separate hematoxylin from eosin, or quantify multiple metallographic phases in a single pass.
Reproducible & Lockable
Save protocols as locked, versioned files for team-wide deployment — every lab member runs the exact same analysis.

Side-by-side: predicted instance segmentation, segmentation overlay, and original input image — the same triptych you get for every ConductVision Image workflow.
Works with your existing tools
Compatibility
Excel & CSV
Every workflow exports a clean CSV with one row per object plus a summary sheet — drop straight into Excel pivot tables.
GraphPad Prism
Output column structure is pre-formatted for direct import into Prism dose-response, grouped, and contingency analyses.
R & Python
Tidy long-format CSVs that load cleanly into pandas, dplyr, or tidyverse pipelines without any reshaping.
ImageJ / Fiji
Annotated overlays export as ImageJ-compatible ROI sets so you can re-open results in your existing Fiji workflow.
OMERO & Bio-Formats
Reads any format Bio-Formats supports — CZI, ND2, LIF, OIB, and 100+ more — directly without conversion.
LIMS & ELN
CSV + JSON sidecar metadata maps cleanly into Benchling, LabArchives, and most LIMS via standard import.
Ready to standardize your image analysis workflow?
Upload your first image and get reproducible results in under 60 seconds. No hardware dongles, no per-seat licenses.