Nuclear & RNA Foci
Count the RNA foci or DNA-damage foci in every nucleus of your fluorescence images, and compare them across samples and conditions.
ConductVision segments nuclei, finds the foci inside each one, assigns every focus to its nucleus and exports counts, intensity and area per nucleus.
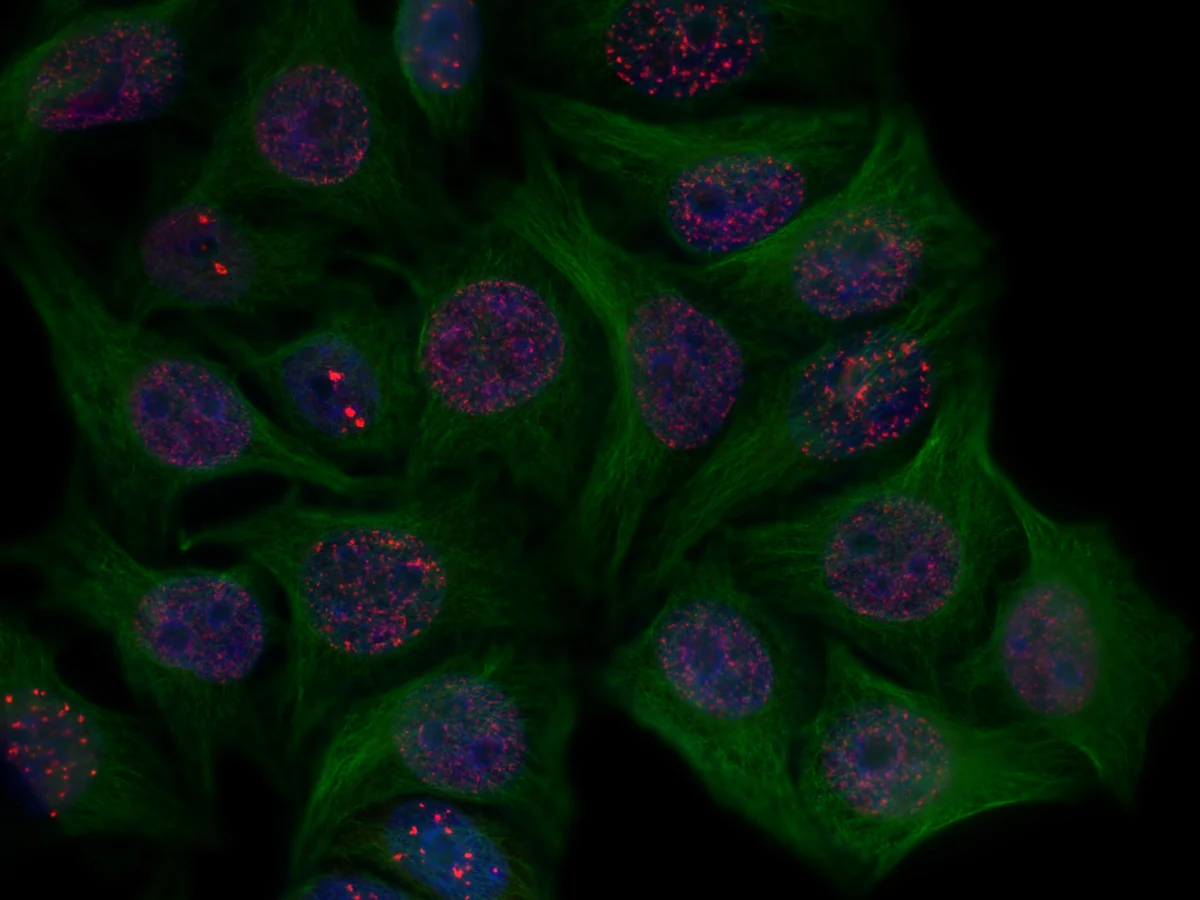
What gets measured
Every metric is reported per nucleus and for the whole population.
Per nucleus
- Foci count
- Mean foci intensity
- Total foci area
Population
- Foci-positive fraction
- Foci-per-nucleus distribution
Signal
- Integrated intensity
Background-corrected
Screening
- Per-well aggregate
- Dose-response ready
How It Works
Load
Load a fluorescence image or a folder of dose points.
Segment nuclei
AI separates touching nuclei to define each per-cell region.
Detect foci
Intranuclear puncta are detected and assigned to their parent nucleus.
Export
Download per-nucleus foci counts, intensities, and per-well aggregates.
Spot detection scored against expert annotations
We scored a Laplacian-of-Gaussian spot detector on a public set of 446 γ-H2AX images of irradiated human lymphocyte nuclei, where γ-H2AX marks DNA double-strand breaks.1 Each score comes from 90 held-out images that played no part in setting the detector.
- F1, detections against expert annotations
- 0.79
- Precision, the share of detections that were annotated foci
- 0.84
- Recall, the share of annotated foci found
- 0.75
- Agreement of counts per image (ICC)
- 0.78
Limits of the scores
- The dataset's annotators marked only large, bright foci and left out small or dim ones.1
- The scored foci are DNA-damage foci in irradiated lymphocytes.
- The detector has no score on RNA foci.
Foci per nucleus in published DM1 images
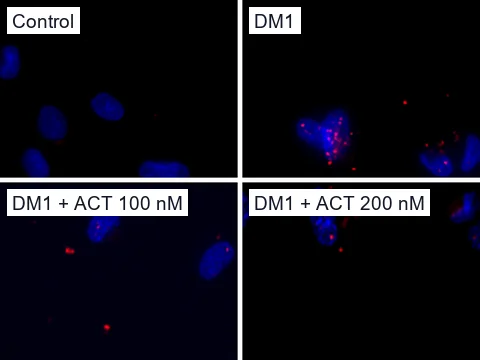
In myotonic dystrophy type 1 (DM1), RNA from an expanded CTG repeat in the DMPK gene stays in the nucleus as foci that sequester MBNL splicing proteins.2 In neurons converted directly from DM1 skin fibroblasts, most nuclei carried CUG repeat RNA foci.2 Counting by hand across 324 nuclei per sample, Eltahir and colleagues found 3.82 foci per DM1 nucleus.2 In the same study, actinomycin D, a potent transcription inhibitor, cut foci per nucleus by 56% at 100 nM and 66% at 200 nM.2,3
In a 2D cell-image check, we ran the spot detector without tuning on one published image per condition from that study.2 The settings used here differ from the scored ones and have no score of their own.
| Neurons | Nuclei | Foci per nucleus | 95% interval |
|---|---|---|---|
| Control | 9 | 0.00 | 0.00 to 0.00 |
| DM1 | 16 | 1.94 | 0.81 to 3.81 |
| DM1, 100 nM actinomycin D | 7 | 1.00 | 0.43 to 1.57 |
| DM1, 200 nM actinomycin D | 7 | 0.57 | 0.14 to 0.86 |
What the check shows, and its limits
- The detector undercounts, finding 1.94 foci per DM1 nucleus where the authors counted 3.82 by hand.2
- Each row is one published field of 7 to 16 nuclei, so its interval describes that field and leaves out variation between experiments.
- On these single fields, the detector found 48% fewer foci per nucleus at 100 nM and 71% fewer at 200 nM, against the authors' 56% and 66%.2
- The 95% interval of the 100 nM change runs from 45% more foci to 81% fewer, so it crosses zero; at 200 nM it runs from 17% to 91% fewer.
- Eltahir and colleagues saw some cell toxicity at 200 nM.2
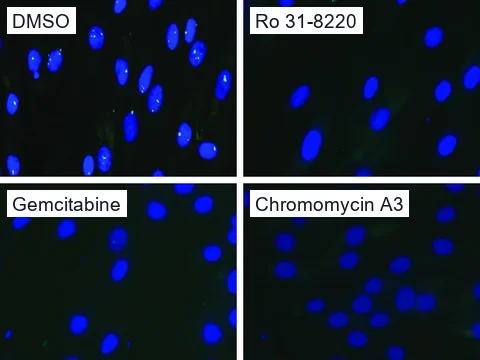
A high-content screen of DM1 and DM2 fibroblast lines found compounds that cleared nuclear foci.4 On the screen's published DM1 images, the spot detector counted 21 foci after DMSO, 1 after Ro 31-8220 and none after gemcitabine or chromomycin A3.4 Chromomycin A3 binds G-C base pairs and inhibits RNA synthesis.4 For gemcitabine and hypericin, toxicity tracked the loss of foci.4 Even where foci disappeared, the repeat RNA stayed in the nucleus.4
So a lower foci count, on its own, cannot separate a rescue from toxicity or blocked transcription. In a pilot, ConductVision reports foci per nucleus beside the share of MBNL1 inside foci and the nuclei left in each field. Splicing comes from the lab's own RT-PCR. The pilot reports a rescue when foci and MBNL1 sequestration fall, splicing improves and the count of nuclei holds.
Finding foci in 3D
To test spot detection in 3D, we simulated image volumes, each holding 6 nuclei with 2 to 6 foci at known positions. On 8 volumes held out from setting the detector, it found 195 of the 198 foci with no false detections (F1 0.992). In further simulated volumes at the same setting, F1 stayed at 0.943 or above for foci whose peak brightness was at least 12 times the noise, and fell to 0.40 at 4 times. All of these volumes are synthetic, so they test the 3D detector and leave staining, optics and real nuclei to a pilot.
RNA foci in Fuchs endothelial corneal dystrophy
Fuchs endothelial corneal dystrophy affects about 5% of middle-aged Caucasians in the United States.5 Its strongest genetic link is an expanded CTG repeat in an intron of the TCF4 gene, found in most people with the disease.5 In corneal endothelial cells the repeat RNA forms nuclear foci that hold the splicing factor MBNL1, as in DM1.5
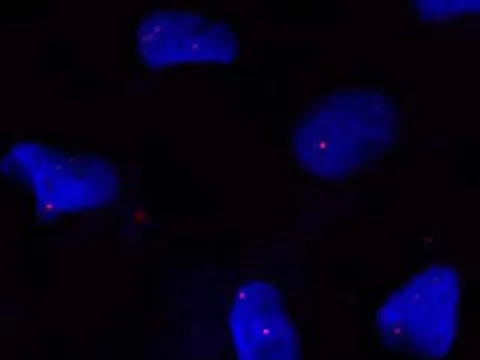
In endothelium from 8 people with the expansion, 33% to 88% of cells carried foci, and the 5 samples without it had none.6 Hu and colleagues found about 2 sense-strand foci per endothelial cell.7 Each focus was a single RNA molecule.7 In corneal endothelial cells grown from affected donors, an antisense oligonucleotide against the repeat cut foci, MBNL1 recruitment to foci and missplicing.8
Single-molecule foci can be dimmer than the large, bright foci in the benchmark, so a pilot begins by checking ConductVision's counts against the lab's own counts by hand. The pilot then reports foci per nucleus and the share of cells with foci in each sample.
References
- Duchrow L, Voß I, Franke R (2026). Irradiated-Cell-Foci. Zenodo (dataset).
- Eltahir MK, Nakamori M, Hattori S, et al. (2022). Pharmacotherapy alleviates pathological changes in human direct reprogrammed neuronal cell model of myotonic dystrophy type 1. PLOS ONE.
- Siboni RB, Nakamori M, Wagner SD, et al. (2015). Actinomycin D Specifically Reduces Expanded CUG Repeat RNA in Myotonic Dystrophy Models. Cell Reports.
- Ketley A, Chen CZ, Li X, et al. (2014). High-content screening identifies small molecules that remove nuclear foci, affect MBNL distribution and CELF1 protein levels via a PKC-independent pathway in myotonic dystrophy cell lines. Human Molecular Genetics.
- Du J, Aleff RA, Soragni E, et al. (2015). RNA Toxicity and Missplicing in the Common Eye Disease Fuchs Endothelial Corneal Dystrophy. Journal of Biological Chemistry.
- Mootha VV, Hussain I, Cunnusamy K, et al. (2015). TCF4 Triplet Repeat Expansion and Nuclear RNA Foci in Fuchs' Endothelial Corneal Dystrophy. Investigative Ophthalmology & Visual Science.
- Hu J, Rong Z, Gong X, et al. (2018). Oligonucleotides targeting TCF4 triplet repeat expansion inhibit RNA foci and mis-splicing in Fuchs’ dystrophy. Human Molecular Genetics.
- Zarouchlioti C, Sanchez-Pintado B, Hafford Tear NJ, et al. (2018). Antisense Therapy for a Common Corneal Dystrophy Ameliorates TCF4 Repeat Expansion-Mediated Toxicity. The American Journal of Human Genetics.


Ready to run this assay on your own images?
Request a demo and see ConductVision count the foci in your own fluorescence images.
Request a Demo