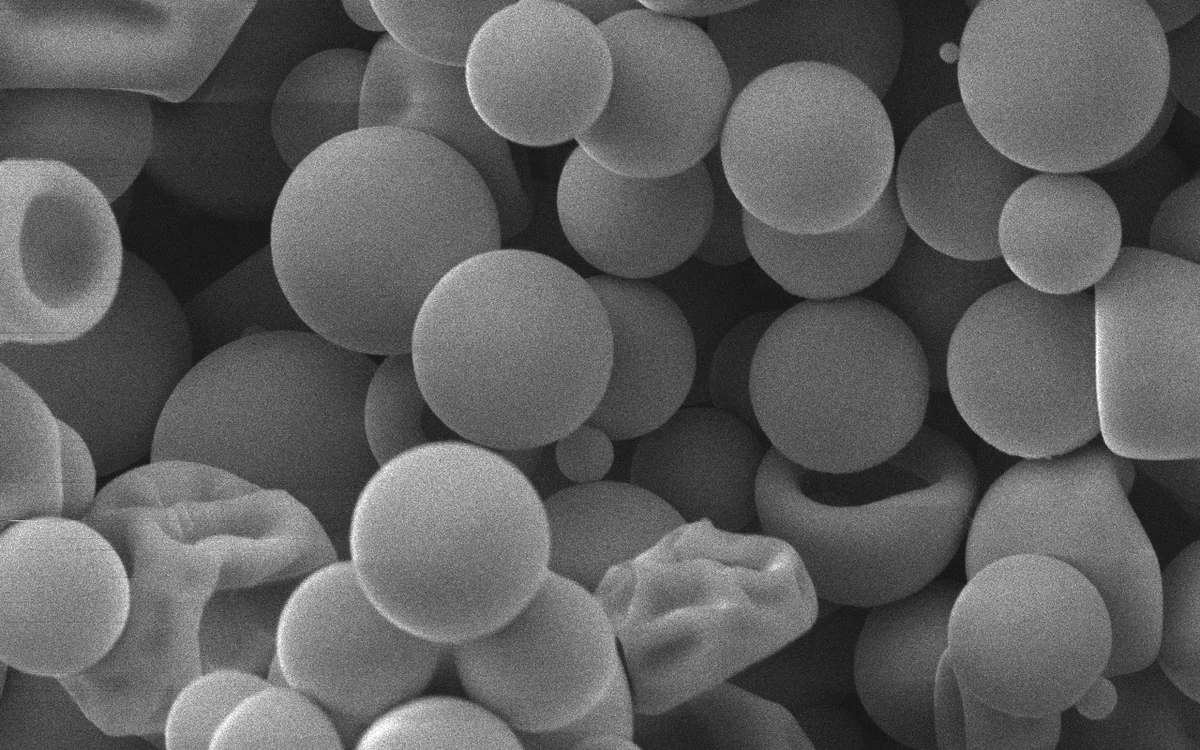
Microsphere Analysis
Count, diameter & size distribution for drug-delivery and calibration microspheres
Example outputs shown for illustration. Numbers depend on your samples and protocol.
Image: SEM of spherical microparticles — Altynay.Kaiyrgali, CC BY 4.0, via Wikimedia Commons
Results
What the analysis returns, tied back to the image it came from.
Diameter distribution with lognormal fit
Count-per-bin histogram with normal and lognormal fits and D10/D50/D90 — reported number-weighted (by count), not volume-weighted.
Micrometer-calibrated scale
Calibrate against a known length or scale bar so diameters are reported in real microns; accuracy depends on your calibration standard.
Touching-sphere separation
Separates contacting microspheres and excludes border particles for accurate counts, in line with ISO 13322-1 image-analysis practice.
Built for medical-device & pharma QC
Span and CV% for monodispersity, spec pass/fail, and audit-friendly exports. For compendial (USP/EP) compliance, confirm method comparability with your regulatory team.
From image to reviewed result
- 1
Upload
Load microscopy or SEM images of microspheres
- 2
Calibrate
Set the pixels-per-micron scale
- 3
Measure
AI detects spheres and measures equivalent diameter
- 4
Export
Download diameter distribution, D-values, and per-particle data

From micrograph to diameter distribution
Detected spheres, a number-weighted diameter histogram with a lognormal fit, D10/D50/D90 markers, and a QC pass/fail verdict.
Count & diameter
Equivalent-circle diameter per sphere with total count
D10/D50/D90 & span
Number-weighted percentiles and breadth
Distribution fit
Normal and lognormal fits with goodness-of-fit
Works with your existing tools
Try it free
Browser-based tools — your data never leaves your machine.
Microsphere Analysis with ConductVision Image
Measure microsphere count, diameter, and size distribution from microscopy images for medical-device and pharmaceutical QC — drug-delivery microspheres, embolization beads, and calibration beads. ConductVision separates touching spheres, reports number-weighted D10/D50/D90 and span, and builds a diameter histogram with lognormal fit.
Not sure this is the right measurement?
Send a representative image and your measurement goal. A ConductVision scientist will confirm whether this is the right fit, or point you to the closer workflow, before you commit to a quote.

Send a sample image and a measurement goal
We will show the closest ConductVision workflow and flag what needs custom validation for your images.