Colony Counting Software
AI colony counts from uploaded agar plate images
Example outputs shown for illustration. Numbers depend on your samples and protocol.
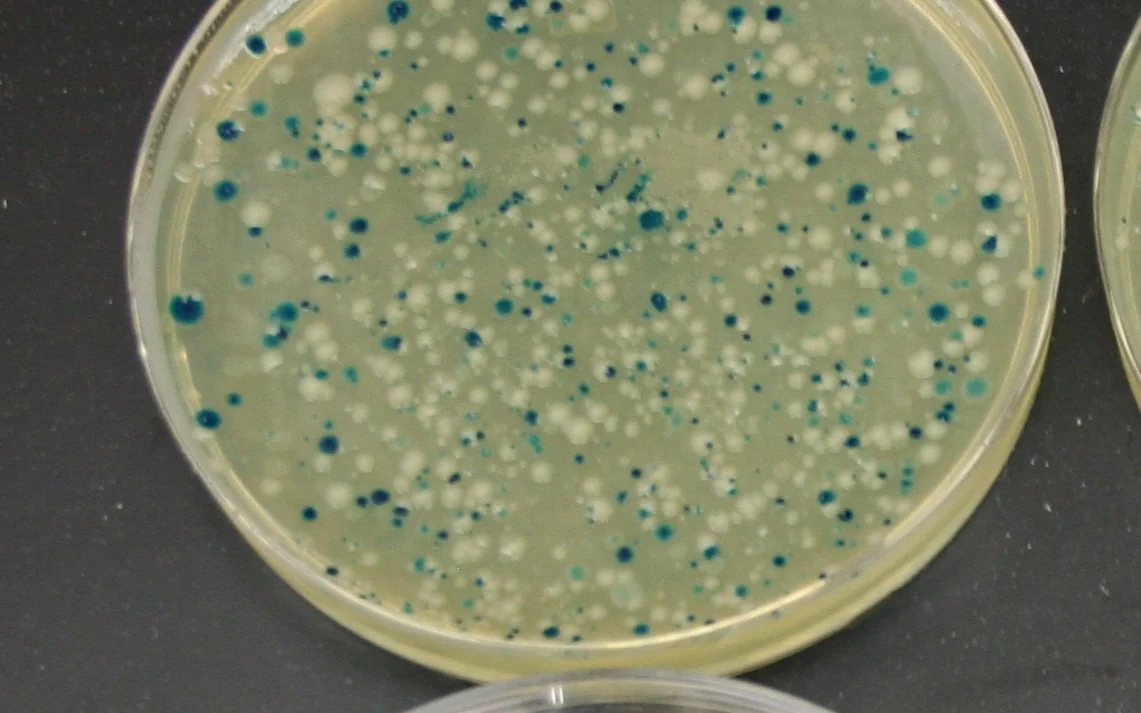
Image: Blue-white screen colony plate — PlaxcoLab, CC BY-SA 2.0, via Wikimedia Commons
Results
Each measurement below comes from your own images, tied back to the annotated frame it came from, so results stay comparable across samples, locations, and conditions.
µm or count
Colony count
Size and shape measured for every detected object, then summarized across the population.
In your report: Per-object table, size distribution, and summary percentiles.
µm or count
Colony area
Size and shape measured for every detected object, then summarized across the population.
In your report: Per-object table, size distribution, and summary percentiles.
µm or count
Colony size distribution
Size and shape measured for every detected object, then summarized across the population.
In your report: Per-object table, size distribution, and summary percentiles.
Built around your image set
Use the calibrated images your team already collects, together with the locations you need to compare.
Each report includes
The artifacts your team receives, ready for review and archive.
Annotated image set
Original images with regions of interest, measurement points, masks, and finding overlays.
Measurement table
Location-indexed values, units, distributions, and QC flags in a structured export.
Method record
Calibration evidence, analysis settings, version history, and validation summary.
Confidence in every resultTraceable measurements, reviewed against your agreed reference method.
- Traceable scale
- The report records the image scale, calibration evidence, and a method-specific expanded measurement uncertainty. It does not use one product-wide accuracy number.
- Reference comparison
- The configured method is compared with your accepted reference method or reviewed annotations, and reports bias by measurement range and image condition.
- Detection performance
- Detections are evaluated against reviewed reference regions with precision, recall, and segmentation overlap, separated by the conditions that affect performance.
- Repeatability
- The locked protocol is rerun on the same inputs and on a defined repeat set. The review records variation from image acquisition, sampling, and analysis separately where possible.
From image to reviewed result
- 1
Upload
Load agar plate images from your existing imaging workflow
- 2
Gate
Set colony size, circularity, and plate-edge exclusion rules
- 3
Segment
AI separates colonies from agar, edges, debris, and uneven lighting
- 4
Export
Download colony counts, locations, distribution summaries, and overlays
Built to handle your images
What the analysis does with the awkward cases — the reasons the numbers above hold up on real microscopy.
Uploaded-Image Colony Counts
Designed for the common workflow: upload a plate image, count colonies, and review the overlay. The workflow starts from image files you already have.
Time-Point Comparisons
Analyze images collected at defined time points to compare growth, colony dynamics, or plate-to-plate differences without changing the counting workflow.
Image Folder Processing
Run the same locked settings across a folder of plate images for repeated plates, dilution series, time points, or batch experiments.
Location and Distribution Analysis
Beyond a total count, export colony coordinates and spatial distribution data for density, clustering, and plate-quality review.
Plate Artifact Handling
Exclude glare, rim effects, bubbles, and non-colony debris using locked, plate-aware gates.
Works with your existing tools
Related biology applications
Use these Life Science pages when the same image-analysis method needs to be evaluated in the context of an assay, marker panel, plate workflow, or biological endpoint.
Try it free
Browser-based tools — your data never leaves your machine.
Colony Counting Software with ConductVision Image
ConductVision Colony Counting Software turns existing agar plate images into reproducible colony counts, segmentation masks, colony locations, and spatial distribution summaries. Upload one final plate image, compare defined time-point images, or process an image folder from an existing workflow. It is software for image analysis, not a separate device.
Not sure this is the right measurement?
Send a representative image and your measurement goal. A ConductVision scientist will confirm whether this is the right fit, or point you to the closer workflow, before you commit to a quote.
Questions & answers
The questions scientists ask before sending a sample set. If yours is not here, ask a scientist directly.
How do you count bacteria on an agar plate?
Plate a measured, diluted sample, incubate until visible colonies form, then count the countable colonies — typically the plates with roughly 30 to 300 colonies, where each colony is assumed to have grown from one cell. With ConductVision you photograph the plate and upload the image; the software separates colonies from agar, plate edges, glare, and debris and returns the count with a reviewable overlay.
How do you calculate CFU per millilitre?
Divide the counted colonies by the product of the dilution factor and the volume plated: CFU/mL = colonies ÷ (dilution factor × volume plated in mL). For example, 150 colonies from 0.1 mL of a 1:10,000 dilution gives 150 ÷ (0.0001 × 0.1) = 1.5 × 10⁷ CFU/mL. The exported counts drop straight into this calculation.
Why count colonies from an image instead of by eye?
Manual colony counting is slow and varies between people, especially on crowded or unevenly lit plates. Counting from a fixed image applies the same size and circularity gates every time, keeps an audit-friendly overlay, and lets you re-count later without the plate.
Can it batch a dilution series or repeated plates?
Yes. Lock the counting settings on one plate and run the same rules across a folder of images — dilution series, time points, or replicate plates — for consistent counts across the whole experiment.


Send a sample image and a measurement goal
We will show the closest ConductVision workflow and flag what needs custom validation for your images.