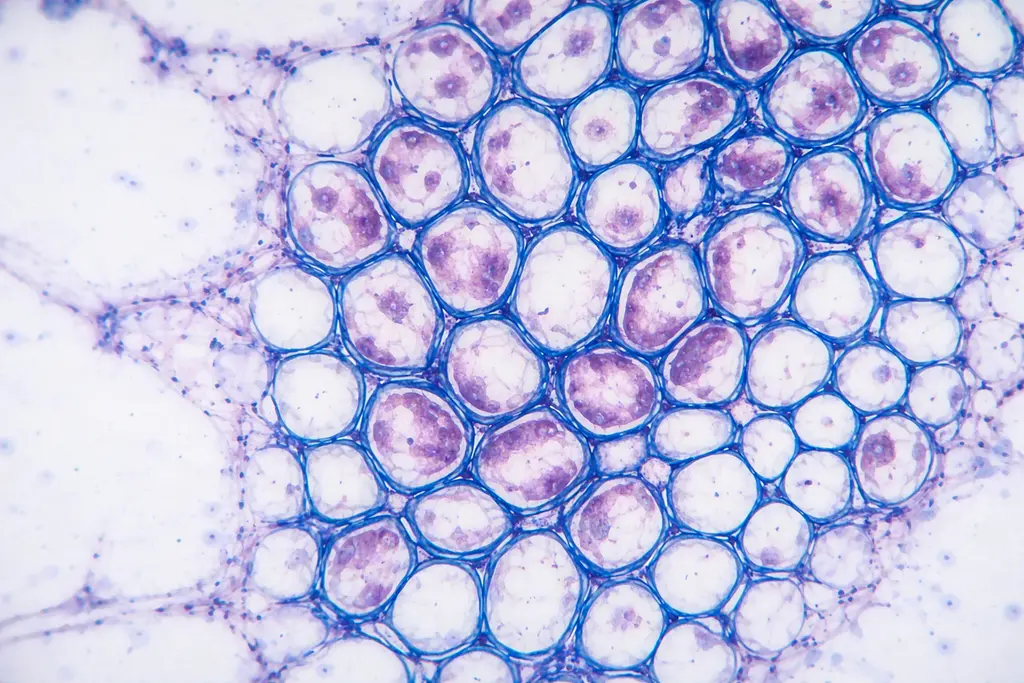
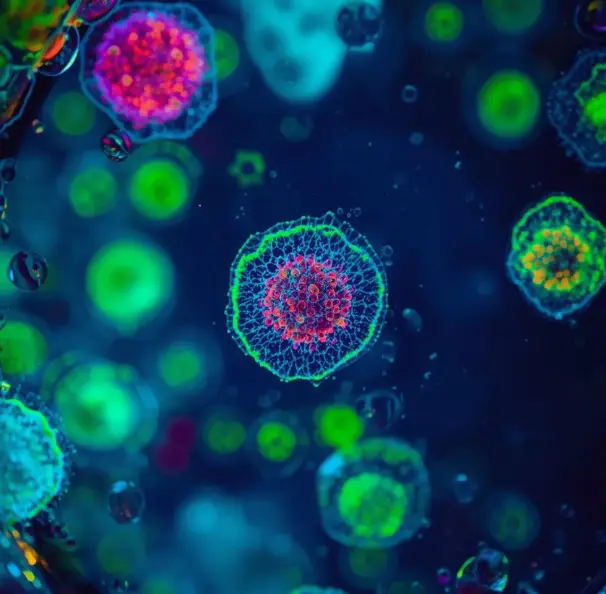
Cell Confluence
Measure culture confluence from phase-contrast images
Example outputs shown for illustration. Numbers depend on your samples and protocol.
Results
Each measurement below comes from your own images, tied back to the annotated frame it came from, so results stay comparable across samples, locations, and conditions.
µm or count
Confluence percent
Size and shape measured for every detected object, then summarized across the population.
In your report: Per-object table, size distribution, and summary percentiles.
µm or count
Confluent area
Size and shape measured for every detected object, then summarized across the population.
In your report: Per-object table, size distribution, and summary percentiles.
µm or count
Growth rate
Size and shape measured for every detected object, then summarized across the population.
In your report: Per-object table, size distribution, and summary percentiles.
Built around your image set
Use the calibrated images your team already collects, together with the locations you need to compare.
Each report includes
The artifacts your team receives, ready for review and archive.
Annotated image set
Original images with regions of interest, measurement points, masks, and finding overlays.
Measurement table
Location-indexed values, units, distributions, and QC flags in a structured export.
Method record
Calibration evidence, analysis settings, version history, and validation summary.
Confidence in every resultTraceable measurements, reviewed against your agreed reference method.
- Traceable scale
- The report records the image scale, calibration evidence, and a method-specific expanded measurement uncertainty. It does not use one product-wide accuracy number.
- Reference comparison
- The configured method is compared with your accepted reference method or reviewed annotations, and reports bias by measurement range and image condition.
- Detection performance
- Detections are evaluated against reviewed reference regions with precision, recall, and segmentation overlap, separated by the conditions that affect performance.
- Repeatability
- The locked protocol is rerun on the same inputs and on a defined repeat set. The review records variation from image acquisition, sampling, and analysis separately where possible.
From image to reviewed result
- 1
Upload
Load phase-contrast or brightfield images
- 2
Segment
AI delineates cell boundaries from substrate
- 3
Measure
Calculate coverage percentage per well
- 4
Export
Download confluence curves and time-series data
Built to handle your images
What the analysis does with the awkward cases — the reasons the numbers above hold up on real microscopy.
Phase-Contrast Compatible
Works with standard phase-contrast and brightfield imaging without fluorescent labels, reducing cost and toxicity
Time-Series Tracking
Monitor confluence changes over hours or days, building growth curves automatically from sequential images
Multi-Well Analysis
Analyze full 96-well plates simultaneously with per-well and aggregate statistics
Works with your existing tools
Related biology applications
Use these Life Science pages when the same image-analysis method needs to be evaluated in the context of an assay, marker panel, plate workflow, or biological endpoint.
Cell Confluence with ConductVision Image
Cell confluence measurement software that quantifies monolayer coverage as a percentage of total surface area. ConductVision segments adherent cell boundaries against the substrate in phase-contrast or brightfield images you upload, providing objective confluence measurements that eliminate observer-dependent estimates and enable consistent passage timing across experiments.
Not sure this is the right measurement?
Send a representative image and your measurement goal. A ConductVision scientist will confirm whether this is the right fit, or point you to the closer workflow, before you commit to a quote.
Questions & answers
The questions scientists ask before sending a sample set. If yours is not here, ask a scientist directly.
What is cell confluence?
Cell confluence is the proportion of a culture surface covered by adherent cells, reported as a percentage. It is the common way to judge how far a culture has grown and when it is ready to passage or treat.
How do you measure confluence from an image?
Upload a phase-contrast or brightfield image, let ConductVision segment cell-covered area from the empty substrate, and read the coverage percentage per well. No fluorescent stain is required, so there is no added cost or phototoxicity.
Can it track confluence over time across a plate?
Yes. Analyze sequential images to build growth curves automatically, and run full 96-well plates for per-well and aggregate confluence in a single batch.


Send a sample image and a measurement goal
We will show the closest ConductVision workflow and flag what needs custom validation for your images.