Social Interaction Tracking
Markerless AI tracking for 6+ animals. No tags, no implants, no stress.
Social behavior is hard to measure at scale
The Challenge
Manual scoring is tedious
Endless frame-by-frame annotation and post-experiment data wrangling consume hours that should be spent on analysis.
Markers alter behavior
Implants, dyes, and handling sessions stress animals and disrupt the natural behavioral patterns you are trying to study.
Group housing is complex
Maintaining identity across 4+ animals during close interactions and occlusions is error-prone without advanced AI.
AI-Powered Segmentation
Our system combines conventional imaging techniques with powerful segmentation algorithms to automatically detect and track each animal. Trained on a minimal set of annotated frames, the machine-learning models maintain proper identity assignment even during close interactions or occlusions.
- Track snouts, tail-bases, and body centroids
- Preserve identity across 6+ animals simultaneously
- Minimal training data required
See Your Results Instantly
ConductVision delivers publication-ready data without manual cleanup. Track x/y/z coordinates, interaction events, and behavioral states — all exportable and ready for statistical analysis.
- 24/7 continuous, non-invasive monitoring
- Automatic behavioral classification
- Export to CSV, Excel, or direct API integration
Six dimensions of social behavior
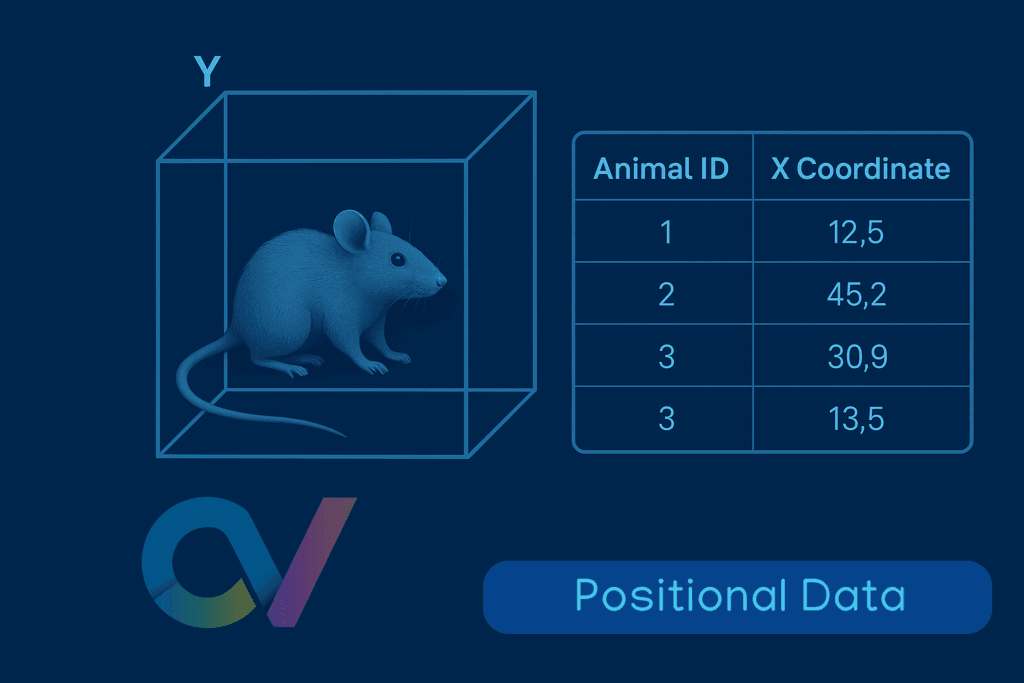
Positional Data
Tracks x, y, z coordinates of each animal in the experimental space with sub-pixel accuracy.
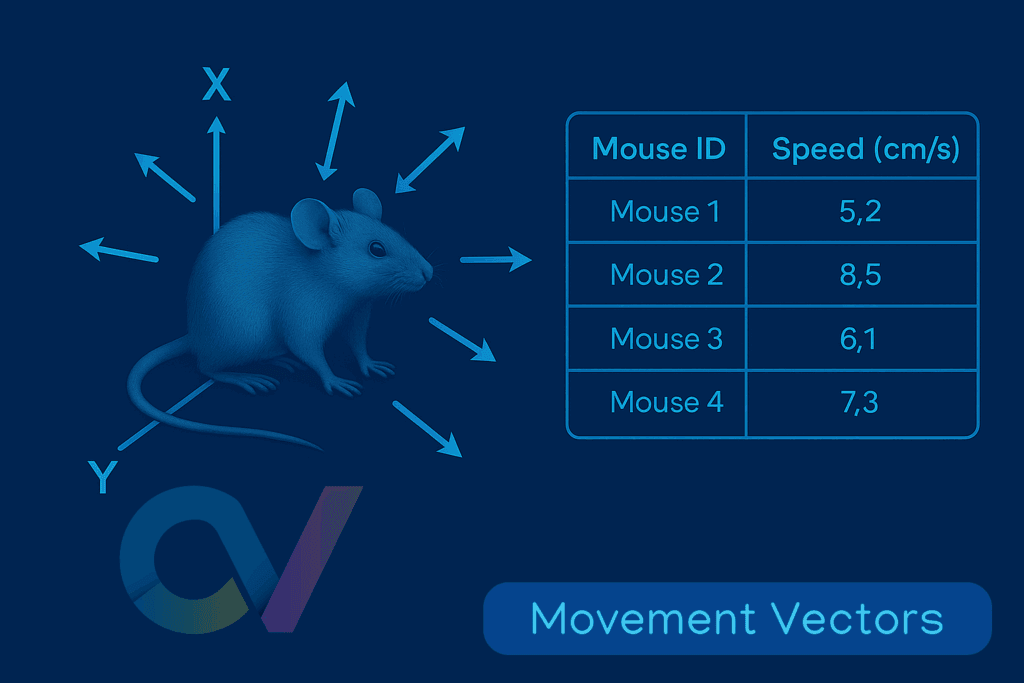
Movement Vectors
Direction and speed visualization using vector diagrams for each tracked subject.
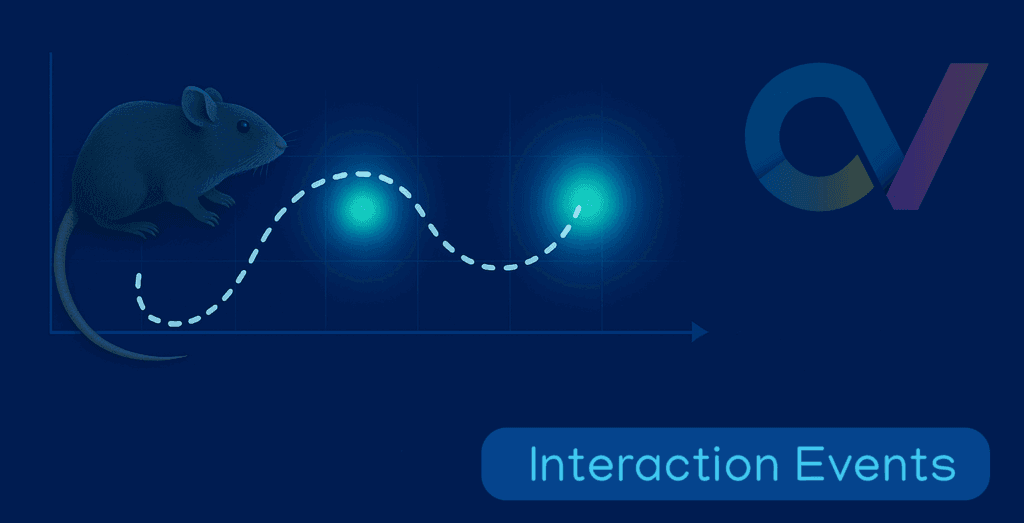
Interaction Events
Identifies when and how animals interact via heatmaps and event timelines.
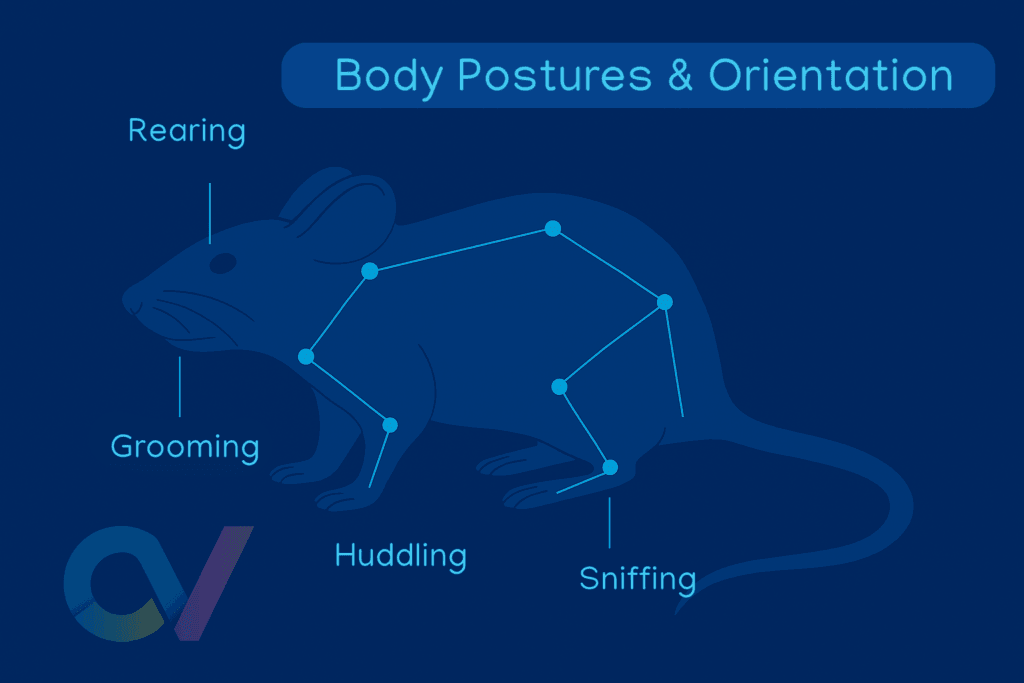
Body Posture & Orientation
Anatomical point overlays and pose estimation for detailed postural analysis.
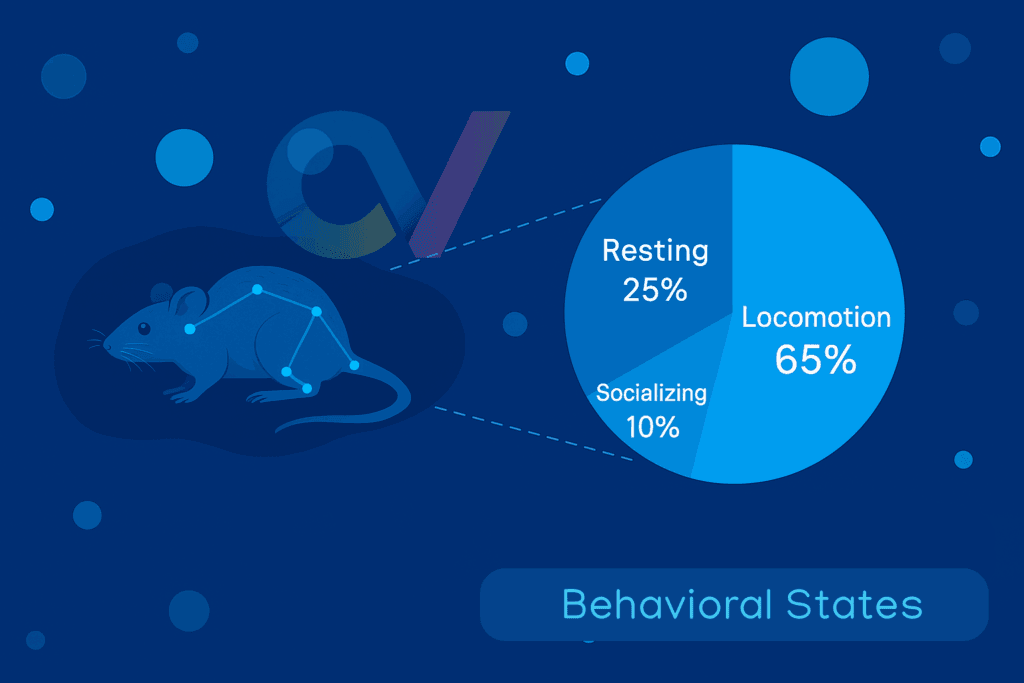
Behavioral States
Automatic classification of locomotion, resting, socializing, and other behavioral states.
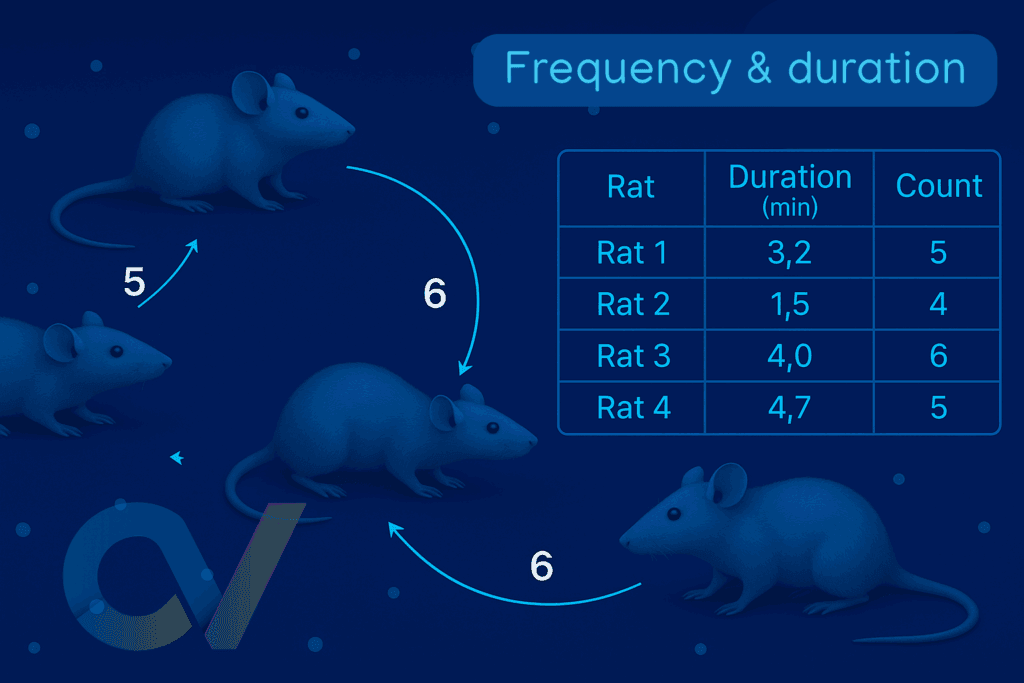
Frequency & Duration
Summarizes engagement patterns with frequency counts and duration metrics across sessions.
See the full picture

Interaction Density Maps
Identify high-activity zones with heatmap overlays that reveal spatial patterns in social behavior.
Social Interaction Graphs
Network graphs where connection thickness represents engagement frequency between individuals.

Behavioral Time Progression
Layered timeline visualizations showing how behavioral patterns evolve across experimental sessions.
Path Tracking Visuals
Animated plots showing how each animal moves through space over time with color-coded trails.
Behavioral Metrics Dashboard
Comparative charts with statistical summaries for publication-ready analysis output.
Built for real research
Enhanced behavioral analysis
ConductVision enables researchers to capture sniffing, touching, locomotion, and body positioning across experimental conditions. With precise tracking of key anatomical points such as snouts and tail-bases, you can quantify interactions that were previously impossible to score reliably at scale.
Group dynamic insights
Group housing allows researchers to understand how different environment conditions affect behavior and recovery. Post-stroke social interaction provides insight into how stroke may affect social hierarchy, aggression, or cooperation, as well as how the social environment affects recovery outcomes.
24/7 accuracy & efficiency
24/7 tracking ensures non-invasive behavioral monitoring, minimizing stress to the animal and reducing error due to physical handling and constant human presence. Long-term, continuous tracking reveals behavioral changes across time and light-dark cycles that are otherwise impossible to obtain with manual scoring methods.
Flexible plans for every lab
From single-workstation licenses to department-wide deployments. No hardware costs, no per-seat dongles.
Individual
Single workstation
- Markerless multi-animal tracking
- Behavioral classification
- Free software updates
- Standard support
Lab
Up to 5 seats
- Markerless multi-animal tracking
- Behavioral classification
- Free software updates
- Priority support
- Volume discount
Department
Unlimited seats + priority support
- Markerless multi-animal tracking
- Behavioral classification
- Free software updates
- Dedicated support
- Custom integration
Ready to streamline your analysis?
See ConductVision in action with your own data.