Individual session report
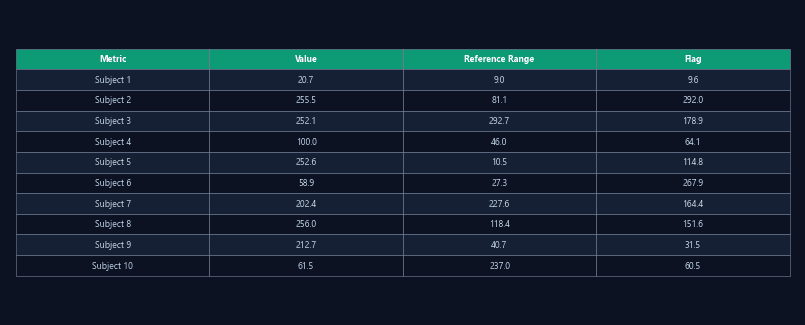
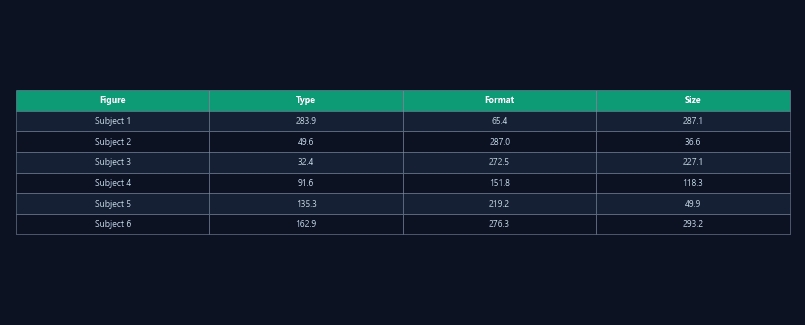
Per-animal report with trajectory plot, heatmap, zone occupancy summary, and all dependent variables in a formatted table.
PDF
From raw recording to publication-ready figures in one click
Formatted PDF reports with trajectory plots, heatmaps, summary statistics tables, and group comparison bar charts — generated automatically from tracking results.

After analysis, researchers export CSV files, import them into statistics software, generate plots in a graphing tool, and assemble figures in a layout application. This pipeline takes hours per experiment and produces inconsistent figure styles across lab members.
ConductVision generates formatted PDF reports directly from analysis results. Reports include trajectory plots, cumulative heatmaps, summary statistics tables, and group comparison charts with consistent formatting.
Per-animal report with trajectory plot, heatmap, zone occupancy summary, and all dependent variables in a formatted table.
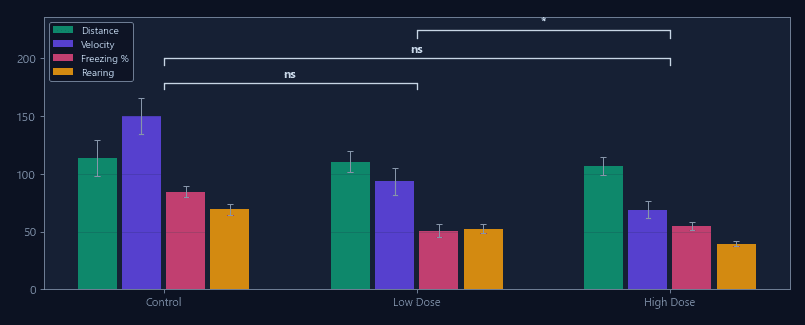
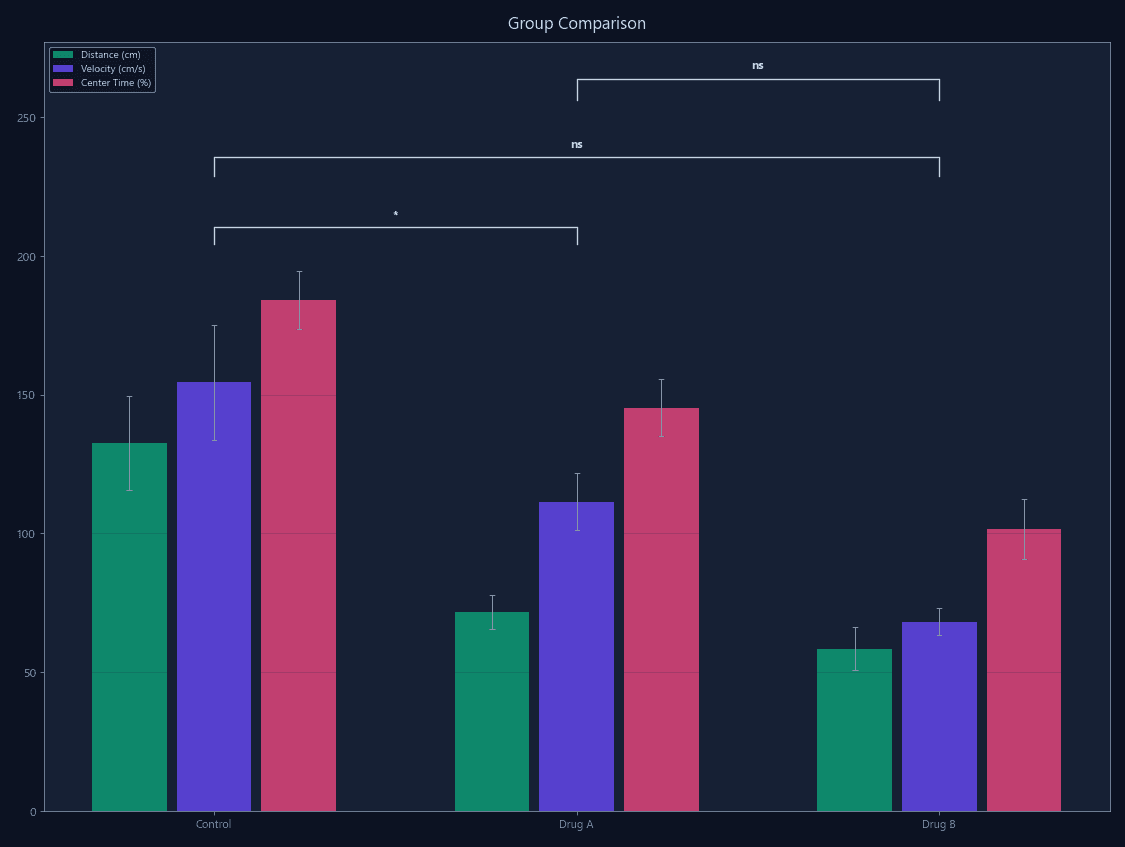
Multi-group comparison with bar/box plots, summary statistics, and effect sizes for all dependent variables.
Individual figure panels (trajectory, heatmap, chart) exported separately as vector SVG or high-resolution PNG for custom figure assembly.
Generate consistent, high-quality figures matching journal specifications — vector format, proper resolution, standardized styling.
Quick summary reports for weekly lab meetings or grant progress updates — generated in seconds, not hours.
Standardized report format for regulated studies — consistent across animals, sessions, and experimenters.
Standardized reports enable consistent data presentation across collaborating sites.
| Feature | ConductVision | Typical systems |
|---|---|---|
| Report generation | One-click from results | Manual multi-tool pipeline |
| Figure format | Vector PDF (publication-ready) | Raster screenshots |
| Group comparisons | Built-in with auto cohort assignment | Manual in external software |
| Report templates | Multiple paradigm-specific templates | No templates |
| Consistency across users | Identical formatting guaranteed | Varies by lab member |

Standard CSV/JSON export compatible with any statistical software or analysis pipeline.

Real-time spatial occupancy heatmaps with color-coded density overlays on the arena view.
Built-in group statistics with t-tests, ANOVA, effect sizes, and multiple comparison corrections.
Run an analysis and click Report — publication-ready figures delivered as PDF.