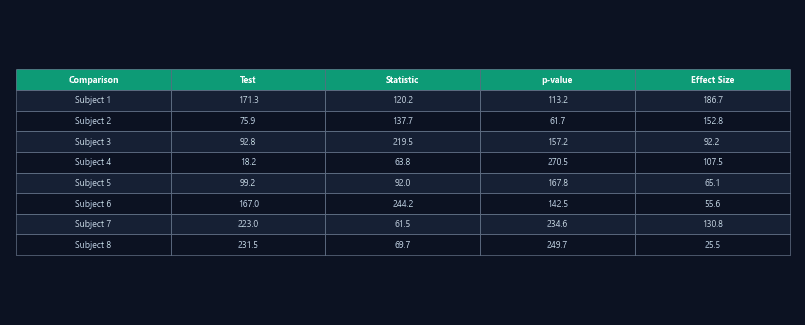
Statistical results table
Test statistic, degrees of freedom, p-value, effect size, and confidence interval for each comparison.
CSVJSONPDF
Statistical analysis without leaving the platform
T-tests, one-way ANOVA, post-hoc comparisons, and effect sizes (Cohen's d) computed directly from tracking results — no export to R, SPSS, or Prism required for standard analyses.
Even simple treatment-vs-control comparisons require exporting CSVs, importing into statistics software (R, SPSS, Prism), running tests, and copying results back. This adds hours to the workflow and creates version-control challenges.
Select groups, choose a dependent variable, and run a comparison. ConductVision performs the test, computes effect sizes, applies multiple comparison corrections, and reports results — all linked to the source tracking data.
Test statistic, degrees of freedom, p-value, effect size, and confidence interval for each comparison.
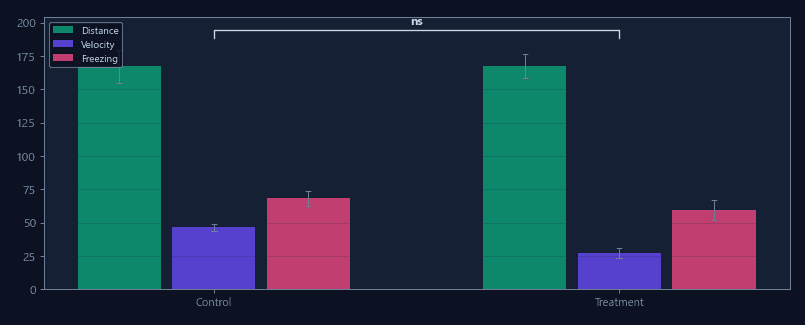
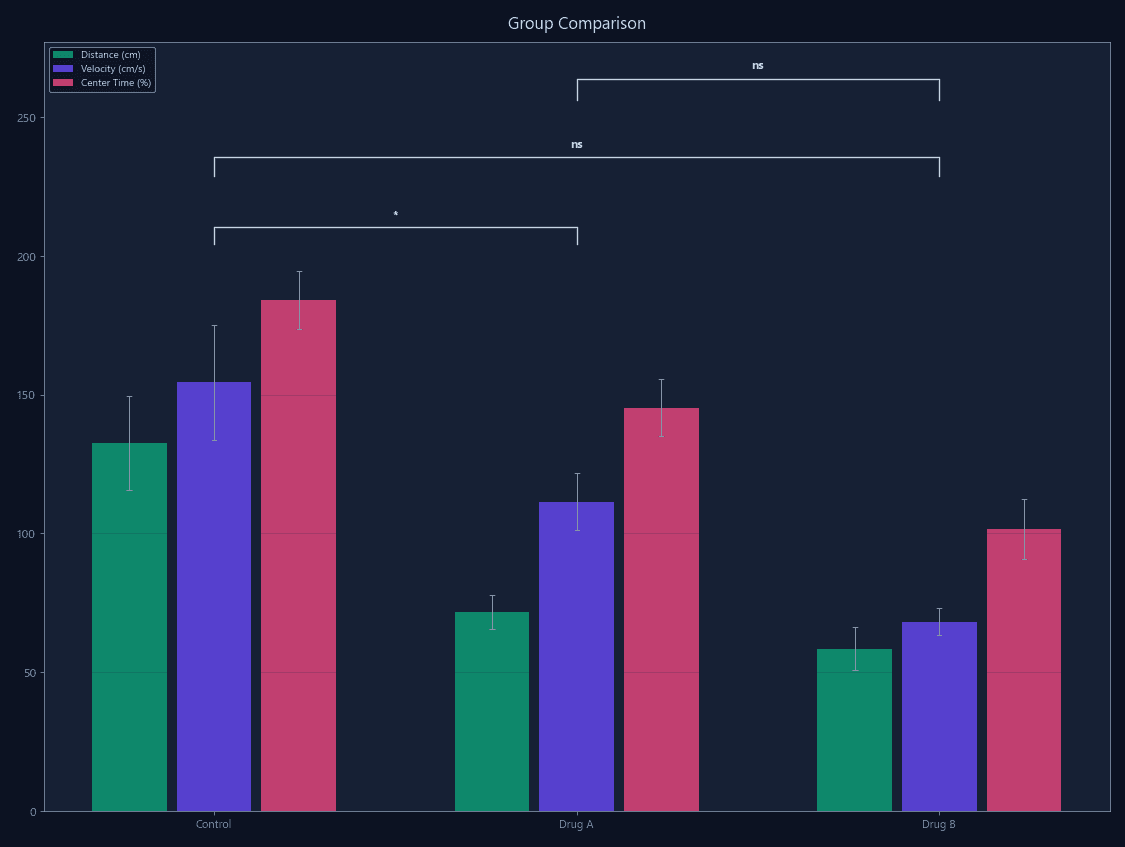
Bar, box, or violin plots with individual data points, group means, and significance brackets.
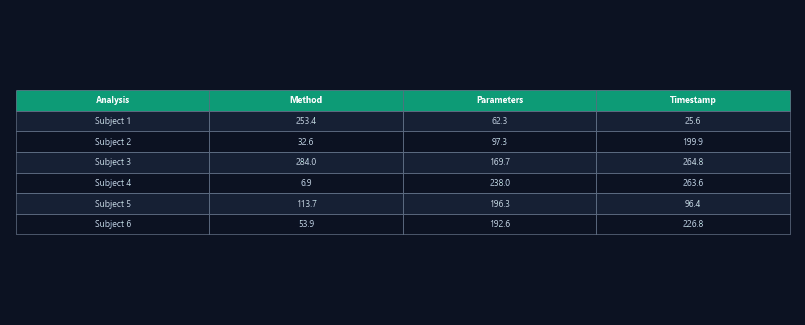
Complete record of which test was run, on which data, with which parameters — linked to source recordings for reproducibility.
Compare treated and control groups on any dependent variable with one click — p-value and effect size reported immediately.
One-way ANOVA across dose groups with post-hoc pairwise comparisons — identify the effective dose range.
Compare WT, heterozygous, and homozygous groups across all behavioral measures simultaneously.
Paired t-tests for within-subject comparisons across time points — baseline vs. treatment, pre vs. post.
| Feature | ConductVision | Typical systems |
|---|---|---|
| Built-in statistics | T-test, ANOVA, post-hoc, effect sizes | Export to external software |
| Effect size reporting | Automatic Cohen's d | Manual calculation |
| Multiple comparison correction | Bonferroni, Holm-Sidak | Not included |
| Data-analysis link | Results linked to source recordings | Disconnected CSV files |
| Consistency | Same test, same parameters, every time | Varies by analyst |

One-click PDF reports with trajectory plots, heatmaps, and group comparisons.

Standard CSV/JSON export compatible with any statistical software or analysis pipeline.
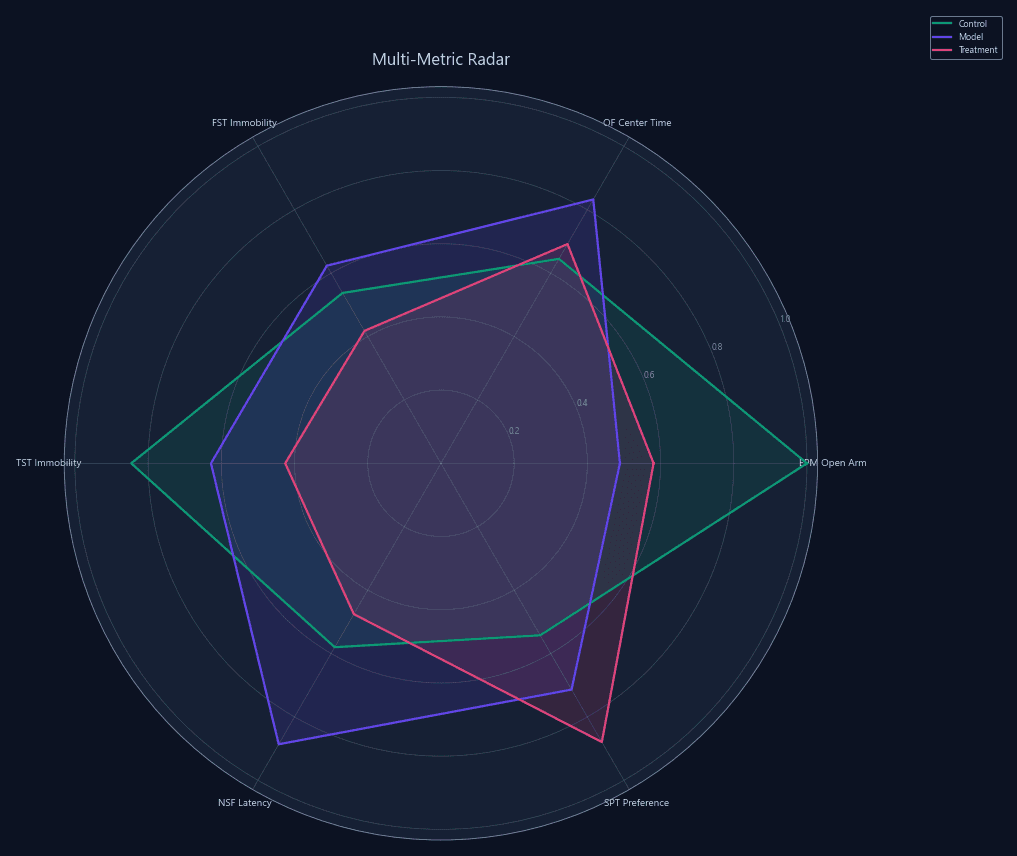
Composite behavioral indices with Z-score normalization across anxiety and depression test batteries.
Select your groups and run a comparison — statistical results in seconds.