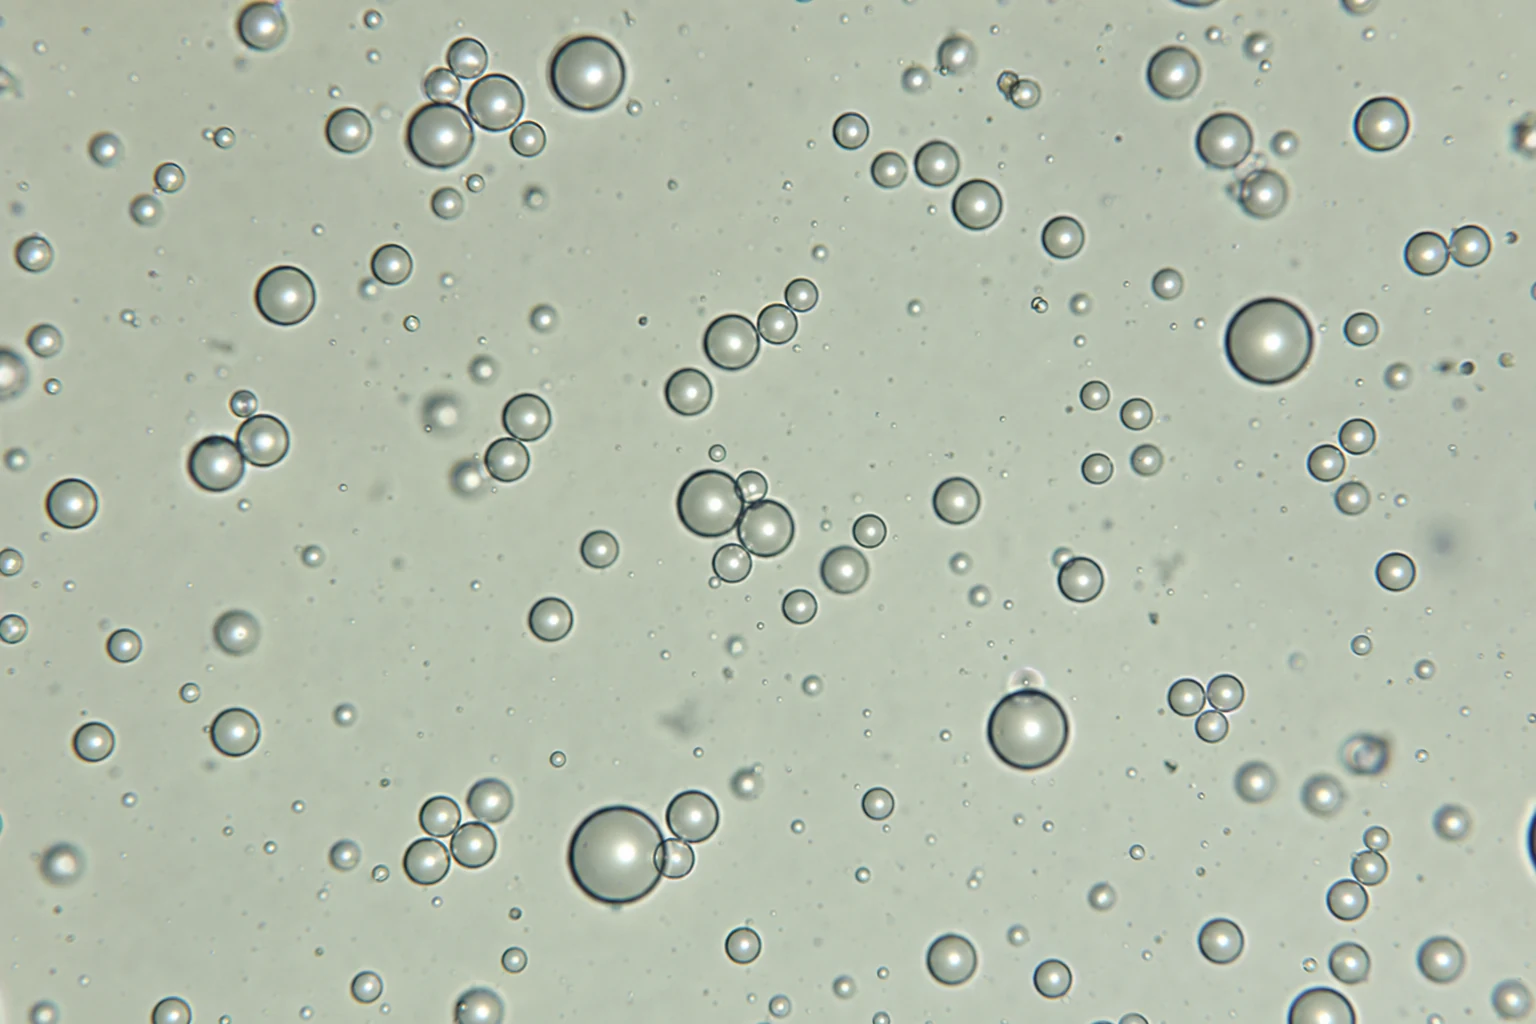
Microsphere image analysis for drug delivery, encapsulation, and microcarrier beads.
Size a whole microsphere batch from micrographs instead of hand-measuring a few dozen beads.
What this page covers
Use this page when the sample is a population of beads rather than cells: PLGA or alginate drug-delivery microspheres, cell-encapsulation microcapsules, microcarriers for suspension culture, or fluorescent calibration beads. The endpoint is the distribution of the batch, so every bead in the field is measured rather than a hand-picked subset.
Talk through your images
Send a representative micrograph, the scale calibration you image with, and the release criterion your batch record reports. We will confirm whether the existing microsphere workflow fits or scope a custom detection rule for touching or swollen beads.
Request a meetingMeasurements
- Bead count
- Equivalent diameter
- D10/D50/D90 (number-weighted)
- Span and CV%
- Sphericity
- Aggregate fraction
Review outputs
- Per-bead detection overlays
- Diameter histograms with normal and lognormal fits
- Per-image and per-batch tables
- CSV exports for batch-to-batch comparison
Image inputs, QC, and outputs
Use this section to decide whether the page matches your assay before requesting a meeting. The goal is to preserve the biological endpoint while making the image analysis repeatable, reviewable, and exportable.
Image inputs
Application analysis starts with representative images that match the endpoint your lab reports. Include controls and edge cases so thresholds can be set against real biological variation, not only ideal fields.
- Primary measurements: Bead count, Equivalent diameter, D10/D50/D90 (number-weighted), and Span and CV%
- Matched positive and negative controls when available
- Consistent magnification, channel order, plate layout, or time-point labels
QC and validation
Each workflow should leave a visible trail from raw image to measurement. Review masks, thresholds, and flagged fields before exporting the final table.
- Raw image and overlay review before batch export
- Locked settings for repeated plates, stains, or time points
- QC flags for dim signal, merged objects, uneven background, or failed segmentation
Outputs for analysis
ConductVision should return both visual evidence and structured data so the result can be checked, summarized, and reused in downstream statistics.
- Typical outputs: Per-bead detection overlays, Diameter histograms with normal and lognormal fits, Per-image and per-batch tables, and CSV exports for batch-to-batch comparison
- Per-image, per-cell, per-object, or per-well tables where relevant
- CSV exports for Prism, Excel, R, Python, or LIMS handoff
Workflows to start from
Open an existing ConductVision page when the workflow already exists, or request a meeting when your assay needs custom thresholds, outputs, or validation rules.
Microsphere detection and sizing
Separate touching spheres, exclude border beads, and measure equivalent diameter against a calibrated scale.
Size distribution calculator
Free tool: paste diameters to get a histogram, normal and lognormal fits, D10/D50/D90, span, and CV%.
Micrograph analyzer
Free tool: upload a micrograph for in-browser bead detection and the same distribution readout.
Encapsulation and payload coverage
Area and coverage measurements where a fluorescent payload or stained core needs quantifying inside the bead.
Related Life Science pages
Use these pages to move between adjacent assays, specialist microscopy workflows, and the full Life Science atlas.
Request a Life Science meeting
Share your assay, representative images, and the measurement you need so the team can map the closest ConductVision workflow.
Microsphere analysis
Open the ConductVision Image workflow behind this page, framed for medical-device and pharma QC.
Life Science atlas
Return to the full biology application atlas for cells, assays, tissue, microscopy, and morphology.
Frequently asked questions
These answers cover the practical questions labs usually ask before sending example images or requesting a ConductVision workflow review.
What images work best for application analysis?
Use representative images from the same microscope, scanner, plate reader, or camera setup used in the study. The most useful examples include controls, typical fields, difficult fields, and any cases that affect Bead count, Equivalent diameter, D10/D50/D90 (number-weighted), and Span and CV%.
Can ConductVision handle custom application endpoints?
Send a representative micrograph, the scale calibration you image with, and the release criterion your batch record reports. We will confirm whether the existing microsphere workflow fits or scope a custom detection rule for touching or swollen beads. ConductScience can confirm whether an existing workflow fits or define custom segmentation, thresholding, review, and export rules for the assay.
What results are usually exported from this workflow?
The expected deliverables include Per-bead detection overlays, Diameter histograms with normal and lognormal fits, and Per-image and per-batch tables, plus structured tables for downstream analysis. The page also lists the specific measurements and review outputs that are most relevant to this application.
Find out if ConductVision fits your application workflow
Send representative images, assay details, and the measurement endpoint. ConductScience can confirm the closest existing workflow or scope a custom analysis path.