Fiber diameter distribution
Mean diameter, CV%, and D10/D50/D90 for wool, synthetic, and nanofiber, measured from the image.
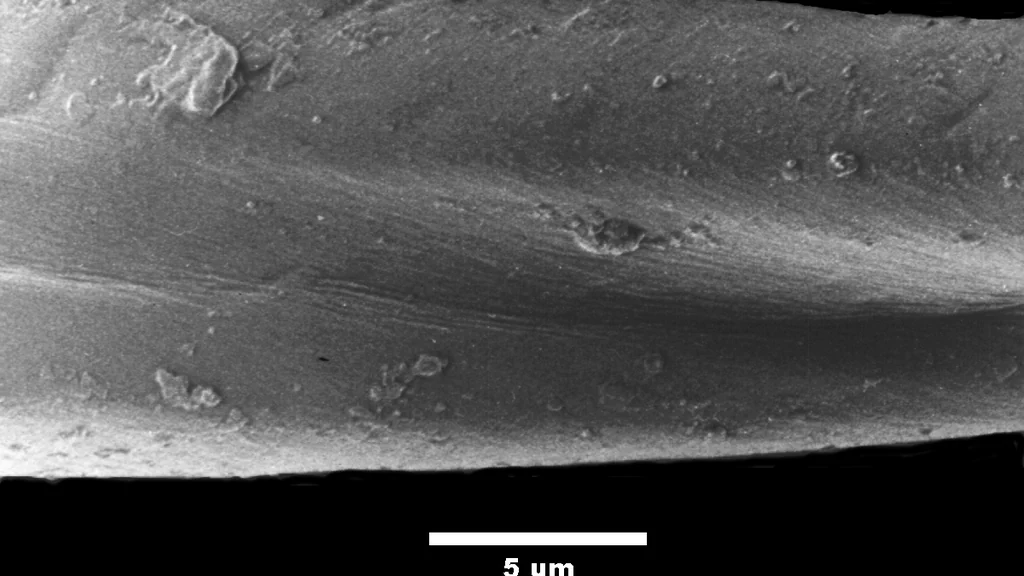
Example outputs shown for illustration. Numbers depend on your samples and protocol.
Results
Each measurement below comes from your own images, tied back to the annotated frame it came from, so results stay comparable across samples, locations, and conditions.
µm or count
Mean diameter
Size and shape measured for every detected object, then summarized across the population.
Example, not a claimed result
In your report: Per-object table, size distribution, and summary percentiles.
µm or count
CV%
Size and shape measured for every detected object, then summarized across the population.
In your report: Per-object table, size distribution, and summary percentiles.
µm or count
D10 / D50 / D90
Size and shape measured for every detected object, then summarized across the population.
In your report: Per-object table, size distribution, and summary percentiles.
µm or count
Diameter histogram
Size and shape measured for every detected object, then summarized across the population.
In your report: Per-object table, size distribution, and summary percentiles.
µm or count
Per-fiber table
Size and shape measured for every detected object, then summarized across the population.
Example, not a claimed result
In your report: Per-object table, size distribution, and summary percentiles.
Built around your image set
Use the calibrated images your team already collects, together with the locations you need to compare.
Each report includes
The artifacts your team receives, ready for review and archive.
Annotated image set
Original images with regions of interest, measurement points, masks, and finding overlays.
Measurement table
Location-indexed values, units, distributions, and QC flags in a structured export.
Method record
Calibration evidence, analysis settings, version history, and validation summary.
Confidence in every resultTraceable measurements, reviewed against your agreed reference method.
- Traceable scale
- The report records the image scale, calibration evidence, and a method-specific expanded measurement uncertainty. It does not use one product-wide accuracy number.
- Reference comparison
- The configured method is compared with your accepted reference method or reviewed annotations, and reports bias by measurement range and image condition.
- Detection performance
- Detections are evaluated against reviewed reference regions with precision, recall, and segmentation overlap, separated by the conditions that affect performance.
- Repeatability
- The locked protocol is rerun on the same inputs and on a defined repeat set. The review records variation from image acquisition, sampling, and analysis separately where possible.
What this result does not establish: Automates the diameter measurement that ASTM D2130 performs by microprojection, and applies to any fiber with a round cross-section. Scale calibration and conformance for acceptance testing remain your lab’s responsibility.
The measurement, today
Microprojection diameter is read off a projected image by hand, a few hundred fibers at a time. It is slow, it drifts between operators, and the distribution tails are the first thing lost.
What it costs
Fiber fineness sets yarn hairiness, handle, and how readily a fabric pills. Wool a micron coarser than specified changes both the price and the product, and it is the tails of the distribution, not the mean, that generate the complaints.
From image to reviewed result
- 1
Image the fibers
Load microprojection, optical, or SEM images of a prepared fiber snippet slide.
- 2
Calibrate the scale
Set pixels-per-micron against a stage micrometer or scale bar so diameters report in real microns.
- 3
Segment and measure
Each fiber is segmented and its diameter measured perpendicular to the fiber axis; crossing fibers and border objects are excluded.
- 4
Read the distribution
Export mean, standard deviation, CV%, D10/D50/D90, the histogram, and the per-fiber table.
Standards & methods
- ASTM D2130
Standards-aware workflows. ConductVision supports these methods; it does not assert certified compliance without validation on your images.
Not sure this is the right measurement?
Send a representative image and your measurement goal. A ConductVision scientist will confirm whether this is the right fit, or point you to the closer workflow, before you commit to a quote.
Related applications
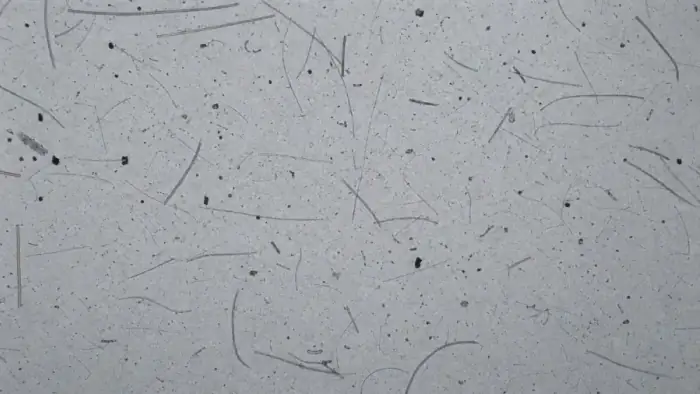
Fiber & inclusion analysis
Count and size fibers and inclusions, with area fraction and class breakdowns.
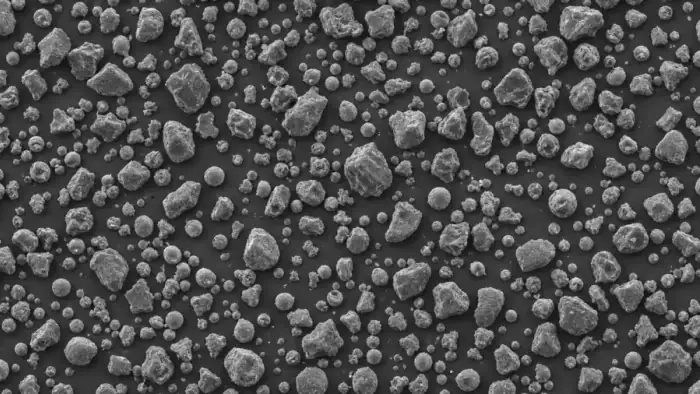
Particle size analysis
Static image-analysis particle sizing with shape descriptors across full fields.
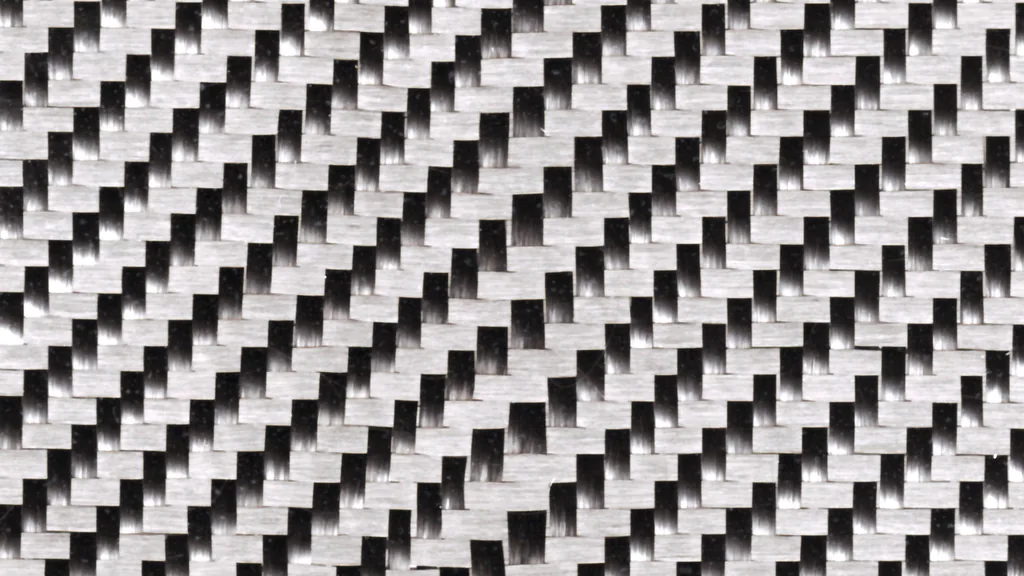
Composite fiber orientation
Fiber orientation, void content, and ply defects from polished sections and CT slices.
Send a sample image and a measurement goal
We will show the closest ConductVision workflow and flag what needs custom validation for your images.