Graphite nodularity
Nodularity percentage and nodule count per mm2 for ductile and compacted graphite iron.
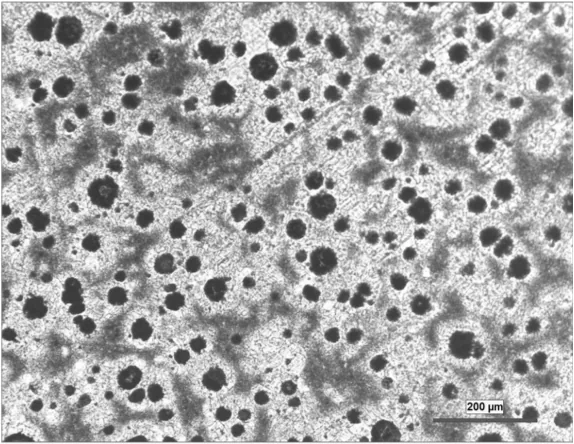
Example outputs shown for illustration. Numbers depend on your samples and protocol.
Results
Each measurement below comes from your own images, tied back to the annotated frame it came from, so results stay comparable across samples, locations, and conditions.
µm or count
Nodularity %
Size and shape measured for every detected object, then summarized across the population.
Example, not a claimed result
In your report: Per-object table, size distribution, and summary percentiles.
µm or count
Nodule count / mm2
Size and shape measured for every detected object, then summarized across the population.
Example, not a claimed result
In your report: Per-object table, size distribution, and summary percentiles.
class
Shape / roundness class
Each detected feature assigned to a class using the agreed rule set, shown on the image.
In your report: Per-feature class, counts by class, and annotated overlays.
µm or count
Size distribution
Size and shape measured for every detected object, then summarized across the population.
In your report: Per-object table, size distribution, and summary percentiles.
µm or count
Per-field table
Size and shape measured for every detected object, then summarized across the population.
Example, not a claimed result
In your report: Per-object table, size distribution, and summary percentiles.
Built around your image set
Use the calibrated images your team already collects, together with the locations you need to compare.
Each report includes
The artifacts your team receives, ready for review and archive.
Annotated image set
Original images with regions of interest, measurement points, masks, and finding overlays.
Measurement table
Location-indexed values, units, distributions, and QC flags in a structured export.
Method record
Calibration evidence, analysis settings, version history, and validation summary.
Confidence in every resultTraceable measurements, reviewed against your agreed reference method.
- Traceable scale
- The report records the image scale, calibration evidence, and a method-specific expanded measurement uncertainty. It does not use one product-wide accuracy number.
- Reference comparison
- The configured method is compared with your accepted reference method or reviewed annotations, and reports bias by measurement range and image condition.
- Detection performance
- Detections are evaluated against reviewed reference regions with precision, recall, and segmentation overlap, separated by the conditions that affect performance.
- Repeatability
- The locked protocol is rerun on the same inputs and on a defined repeat set. The review records variation from image acquisition, sampling, and analysis separately where possible.
What this result does not establish: Classifies graphite particles by shape and reports nodularity and count following ASTM A247. The nodularity percentage depends on the roundness cutoff; set it to your acceptance convention.
The measurement, today
Nodularity is judged by holding a polished section against reference photomicrographs. Two metallurgists reading the same field routinely disagree, and the count is an estimate.
What it costs
Nodularity sets the strength and ductility of a casting. A part graded acceptable by eye can sit below the mechanical spec, and the disagreement is only settled after a part fails.
From image to reviewed result
- 1
Image the section
Load a polished section at 100x, unetched, so graphite reads dark on light.
- 2
Segment the graphite
Every graphite particle is isolated from the matrix.
- 3
Classify by shape
Particles are sorted nodular or non-nodular by roundness.
- 4
Report the result
Nodularity percentage and nodule count per square millimetre follow with the size distribution.
Standards & methods
- ASTM A247
Standards-aware workflows. ConductVision supports these methods; it does not assert certified compliance without validation on your images.
Not sure this is the right measurement?
Send a representative image and your measurement goal. A ConductVision scientist will confirm whether this is the right fit, or point you to the closer workflow, before you commit to a quote.
Related applications
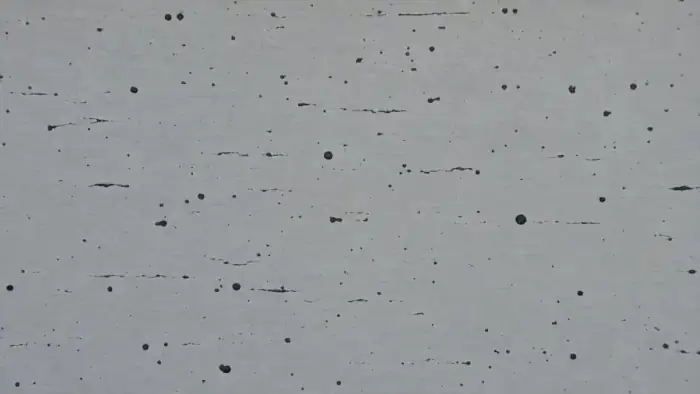
Inclusion & content rating
Detect and classify inclusions, then rate content by type and severity across fields.
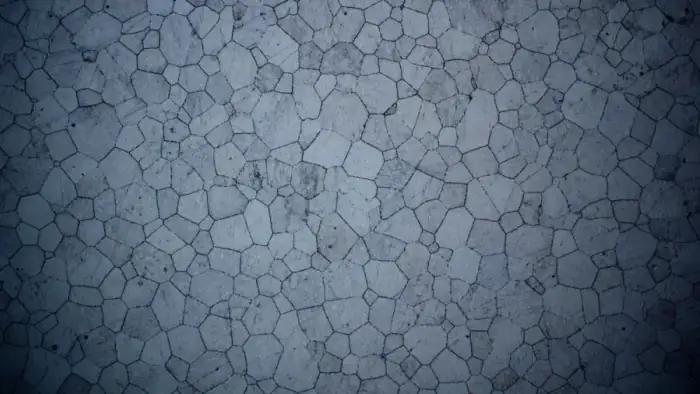
Grain size analysis
Average grain size and full distributions, traced automatically from etched micrographs.
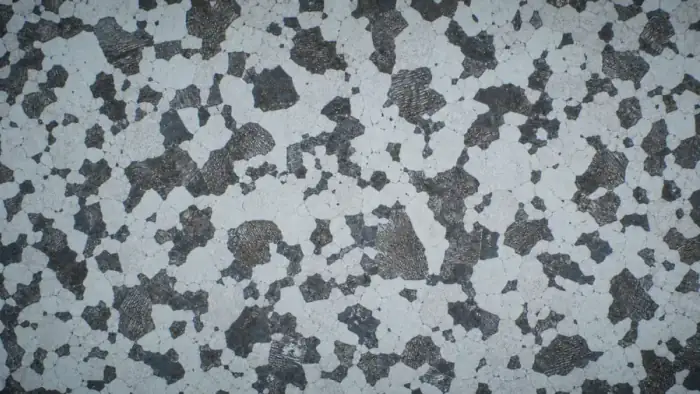
Phase & microstructure fraction
Segment phases and constituents to quantify area fraction and spatial distribution.
Send a sample image and a measurement goal
We will show the closest ConductVision workflow and flag what needs custom validation for your images.