Dimensional stability & skew
Warp and weft shrinkage plus skew, measured from marked-square photographs before and after wash.
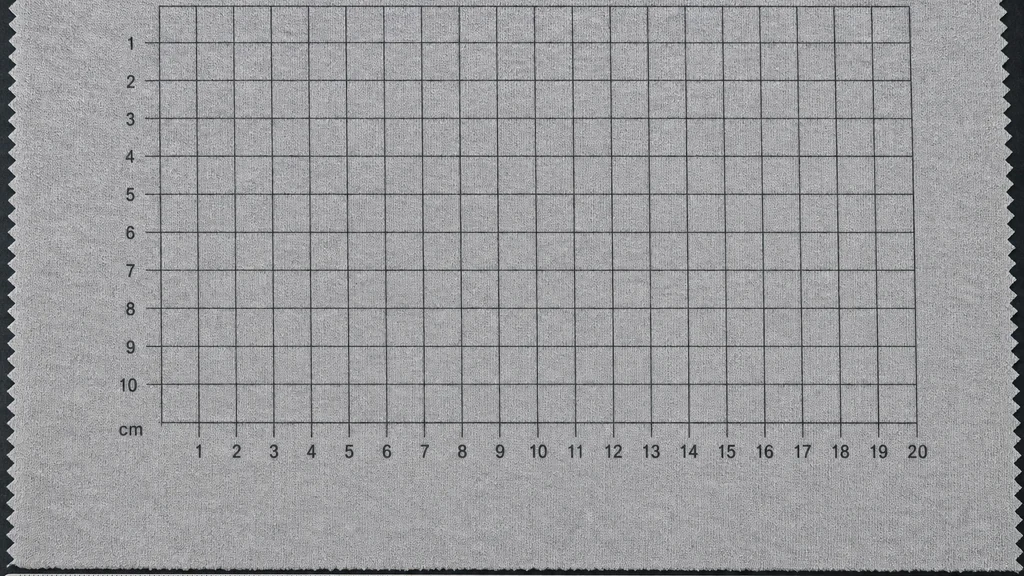
Example outputs shown for illustration. Numbers depend on your samples and protocol.
Image: Illustrative rendering (AI-generated, gpt-image-2), not a photograph of a specific fabric
Results
Each measurement below comes from your own images, tied back to the annotated frame it came from, so results stay comparable across samples, locations, and conditions.
count or µm
Warp shrinkage %
Visible surface features detected, measured, and located against the reviewed image.
Example, not a claimed result
In your report: Per-feature list with size, position, and annotated overlays.
count or µm
Weft shrinkage %
Visible surface features detected, measured, and located against the reviewed image.
Example, not a claimed result
In your report: Per-feature list with size, position, and annotated overlays.
count or µm
Skew / torque %
Visible surface features detected, measured, and located against the reviewed image.
Example, not a claimed result
In your report: Per-feature list with size, position, and annotated overlays.
count or µm
Per-specimen table
Visible surface features detected, measured, and located against the reviewed image.
In your report: Per-feature list with size, position, and annotated overlays.
Built around your image set
Use the calibrated images your team already collects, together with the locations you need to compare.
Each report includes
The artifacts your team receives, ready for review and archive.
Annotated image set
Original images with regions of interest, measurement points, masks, and finding overlays.
Measurement table
Location-indexed values, units, distributions, and QC flags in a structured export.
Method record
Calibration evidence, analysis settings, version history, and validation summary.
Confidence in every resultTraceable measurements, reviewed against your agreed reference method.
- Traceable scale
- The report records the image scale, calibration evidence, and a method-specific expanded measurement uncertainty. It does not use one product-wide accuracy number.
- Reference comparison
- The configured method is compared with your accepted reference method or reviewed annotations, and reports bias by measurement range and image condition.
- Detection performance
- Detections are evaluated against reviewed reference regions with precision, recall, and segmentation overlap, separated by the conditions that affect performance.
- Repeatability
- The locked protocol is rerun on the same inputs and on a defined repeat set. The review records variation from image acquisition, sampling, and analysis separately where possible.
What this result does not establish: Measures the marked reference distances from images. The wash, dry, and conditioning procedure stays yours, and results are only comparable when that procedure is held fixed.
The measurement, today
Marked squares are measured by hand with a ruler, one dimension at a time. Readings differ between operators, skew is usually eyeballed, and nothing about the measurement is recorded beyond a number on a sheet.
What it costs
Shrinkage outside tolerance means garments fail their size spec once the customer washes them. It is one of the most common causes of bulk rejection, and it is discovered at the worst possible moment.
From image to reviewed result
- 1
Photograph before
Image the marked specimen flat, with the reference marks and a scale in frame.
- 2
Wash and dry
Run your own laundering and conditioning procedure. Nothing about it changes.
- 3
Photograph after
Re-image the same specimen on the same rig so the two frames are directly comparable.
- 4
Measure the change
The marks are detected in both frames; warp and weft change and skew are computed and overlaid.
Not sure this is the right measurement?
Send a representative image and your measurement goal. A ConductVision scientist will confirm whether this is the right fit, or point you to the closer workflow, before you commit to a quote.
Related applications
Cover factor & open area
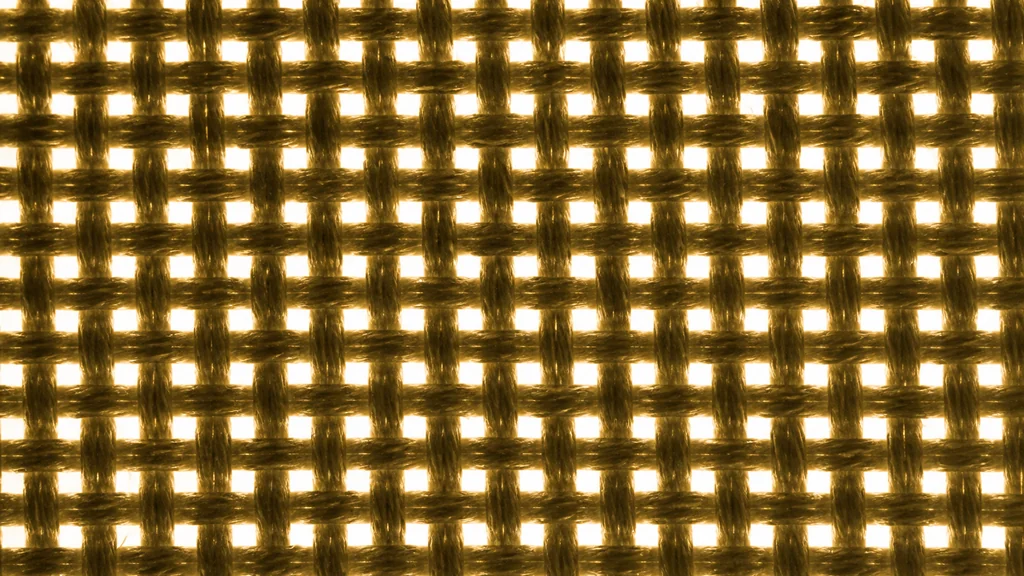
Optical open area, pore size distribution, and cover uniformity measured on the actual fabric.
Fabric inspection (4-point)
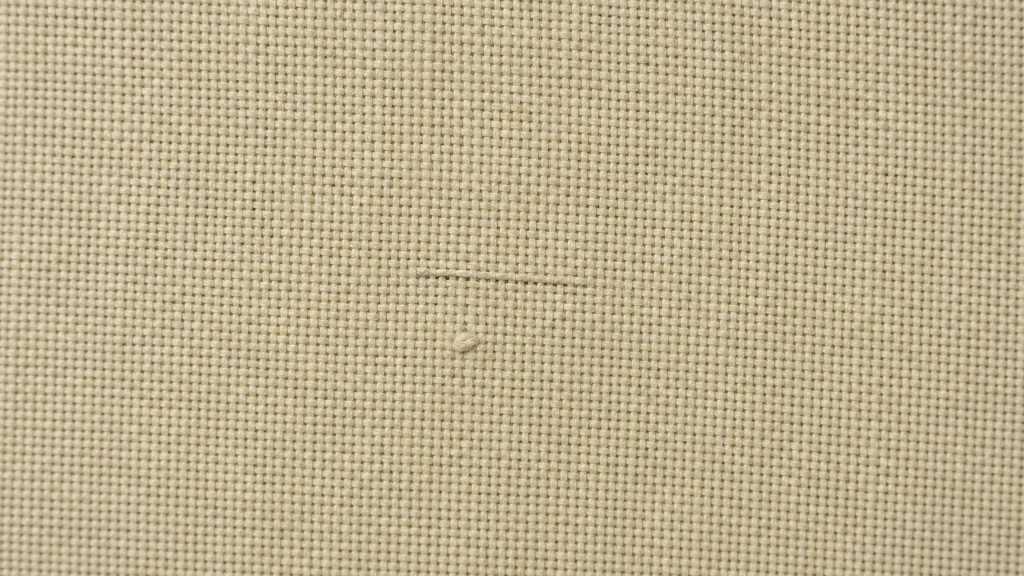
Detect fabric defects, assign demerit points by size, and total them per 100 square yards.
Textile pilling grade
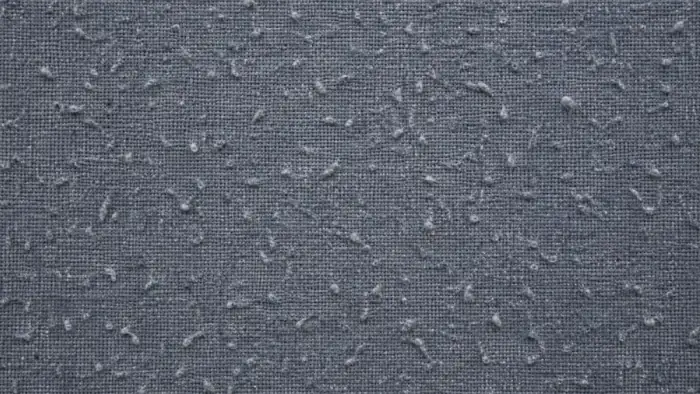
Predict an ISO pilling grade from a fabric image, with density and the features behind the call.
Send a sample image and a measurement goal
We will show the closest ConductVision workflow and flag what needs custom validation for your images.