Fabric inspection (4-point)
Detect fabric defects, assign demerit points by size, and total them per 100 square yards.
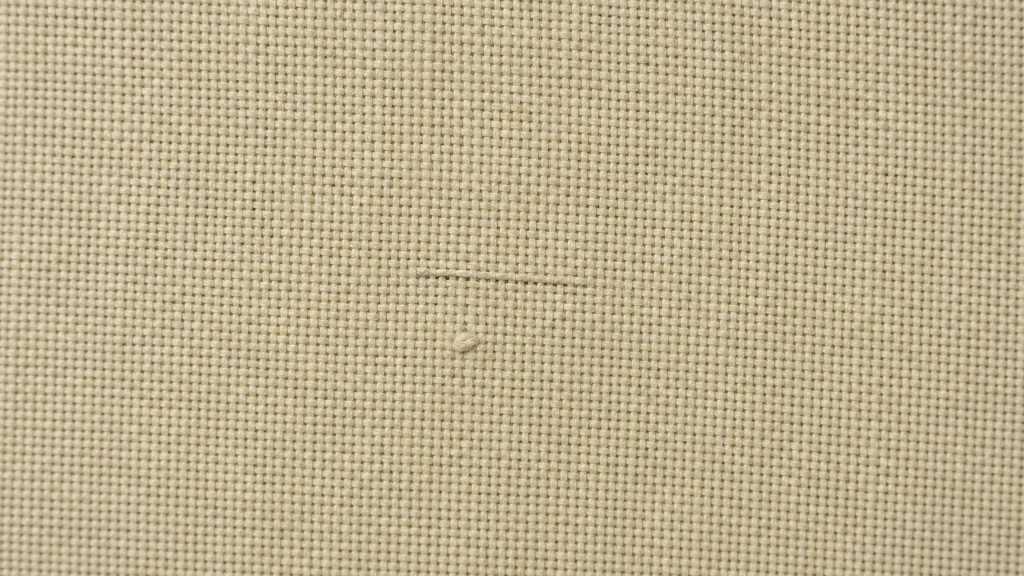
Example outputs shown for illustration. Numbers depend on your samples and protocol.
Image: Illustrative rendering (AI-generated, gpt-image-2), not a photograph of a specific fabric
Results
Each measurement below comes from your own images, tied back to the annotated frame it came from, so results stay comparable across samples, locations, and conditions.
per area
Defect map
Findings placed in sample coordinates to reveal spatial patterns and local density.
Example, not a claimed result
In your report: Coordinate-referenced map, regional density, and representative images.
class
Defect class
Each detected feature assigned to a class using the agreed rule set, shown on the image.
Example, not a claimed result
In your report: Per-feature class, counts by class, and annotated overlays.
count or µm
Penalty points (1–4)
Visible surface features detected, measured, and located against the reviewed image.
Example, not a claimed result
In your report: Per-feature list with size, position, and annotated overlays.
count or µm
Points per 100 yd²
Visible surface features detected, measured, and located against the reviewed image.
In your report: Per-feature list with size, position, and annotated overlays.
class
Roll disposition
Each detected feature assigned to a class using the agreed rule set, shown on the image.
In your report: Per-feature class, counts by class, and annotated overlays.
Built around your image set
Use the calibrated images your team already collects, together with the locations you need to compare.
Each report includes
The artifacts your team receives, ready for review and archive.
Annotated image set
Original images with regions of interest, measurement points, masks, and finding overlays.
Measurement table
Location-indexed values, units, distributions, and QC flags in a structured export.
Method record
Calibration evidence, analysis settings, version history, and validation summary.
Confidence in every resultTraceable measurements, reviewed against your agreed reference method.
- Traceable scale
- The report records the image scale, calibration evidence, and a method-specific expanded measurement uncertainty. It does not use one product-wide accuracy number.
- Reference comparison
- The configured method is compared with your accepted reference method or reviewed annotations, and reports bias by measurement range and image condition.
- Detection performance
- Detections are evaluated against reviewed reference regions with precision, recall, and segmentation overlap, separated by the conditions that affect performance.
- Repeatability
- The locked protocol is rerun on the same inputs and on a defined repeat set. The review records variation from image acquisition, sampling, and analysis separately where possible.
What this result does not establish: Assigns demerit points from detected defect size, following the four-point convention. Acceptance thresholds are set between you and your buyer, and final roll disposition stays with the inspector.
The measurement, today
Rolls are graded by eye on a lit table at speed. Small defects are missed, severity calls drift between inspectors and shifts, and the roll grade is only as reproducible as the person assigning it.
What it costs
Points per 100 square yards decide whether a roll ships, is downgraded to seconds, or is rejected outright. A missed defect reaches the cutting table, where its cost is multiplied by every panel cut from the roll.
From image to reviewed result
- 1
Scan the roll
Feed line-scan frames or inspection-table images across the full fabric width.
- 2
Detect and classify
Multi-class detection separates holes, slubs, broken ends and picks, floats, and stains from weave texture.
- 3
Score by size
Each defect earns 1 to 4 penalty points from its measured length. No single defect exceeds 4 points, and no linear unit exceeds 4 points regardless of how many defects it holds.
- 4
Total and dispose
Points are normalised per 100 square yards and checked against the acceptance threshold you agreed with the buyer.
Standards & methods
- ASTM D5430
Standards-aware workflows. ConductVision supports these methods; it does not assert certified compliance without validation on your images.
Not sure this is the right measurement?
Send a representative image and your measurement goal. A ConductVision scientist will confirm whether this is the right fit, or point you to the closer workflow, before you commit to a quote.
Related applications
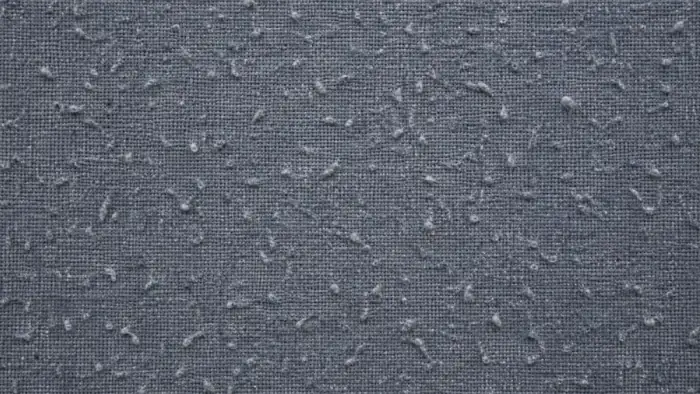
Textile pilling grade
Predict an ISO pilling grade from a fabric image, with density and the features behind the call.
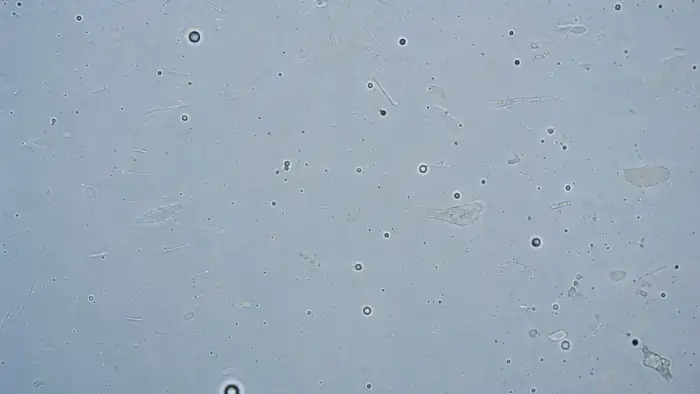
Polymer film & membrane defects
Pinholes, bubbles, scratches, and coverage uniformity for films and membranes.
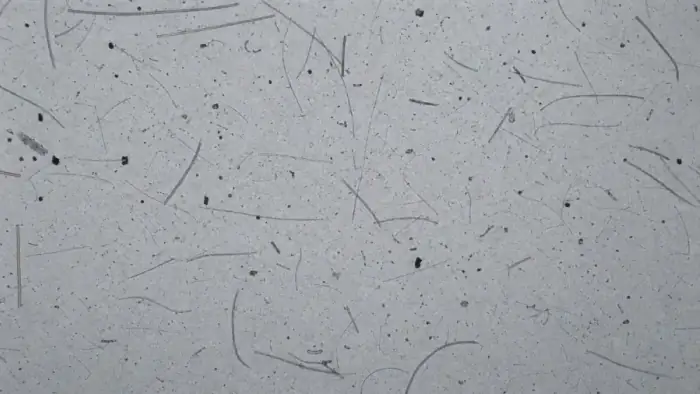
Fiber & inclusion analysis
Count and size fibers and inclusions, with area fraction and class breakdowns.
Send a sample image and a measurement goal
We will show the closest ConductVision workflow and flag what needs custom validation for your images.