ConductVision Disease and Toxicity Models
Organoid image analysis methods and validation
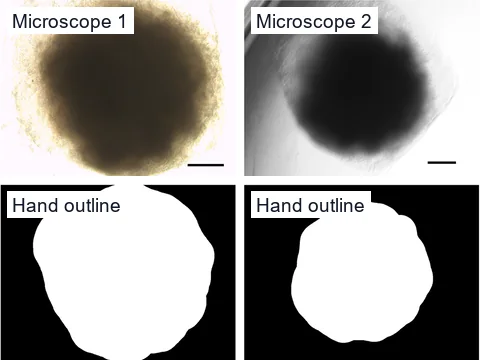
We checked our automatic organoid outlines against outlines drawn by hand, in a public dataset of brain organoid microscope images from two laboratories.
Dataset
A public dataset of brain organoid images
Schröter and colleagues imaged 64 brain organoids from four iPSC lines at ten time points between day 2 and day 30.1 The four lines are a healthy control and three disease lines: TUBA1A tubulinopathy, TUBB2A tubulinopathy and tyrosine hydroxylase deficiency.1 Each line gave 16 organoids, grown as technical replicates.1 Because each genotype comes from one cell line, a difference may reflect the genotype or that particular line.
Each organoid was imaged on two brightfield microscopes in separate laboratories, and twice on day 12, before and after embedding.1 That gives 1,407 images, after one image that showed only background was left out.1 The authors also outlined each organoid by hand in every image.1
Automatic outlines
Our automatic outlines against outlines drawn by hand
Our method finds the well in each image, picks out the organoid inside it by brightness and outlines it, with no correction by hand. We developed it on images from this dataset, then scored our automatic outlines against the outlines drawn by hand in all 1,407 microscope images at about 3 µm per pixel. Median agreement was a Dice score of 0.88, or 0.79 as intersection over union.
On day-2 images, our outlines currently cover about 2.3 times the area of the outlines drawn by hand. In the second laboratory's images, the same organoids come out 13 to 34 percent larger than in the first. So growth measured from day 2, and comparisons between imaging sites, are not yet reliable on our outlines.
Four lines
Two disease lines measured larger
On our automatic outlines of the microscope images at about 3 µm per pixel, we measured each organoid's area, perimeter, equivalent diameter, and major and minor axis. Averaged over all of each organoid's images, the TUBA1A and tyrosine hydroxylase deficiency lines were larger than the healthy line on all five measures. Mean projected area was 16 percent larger in the TUBA1A line and 38 percent larger in the tyrosine hydroxylase deficiency line. Rank-biserial correlations ran from 0.95 to 1.00, where 1.00 means the two lines did not overlap at all. Adjusted q values were below 0.0001, and every difference held when any one organoid was left out. The second laboratory's images enlarge the healthy line's outlines more than those of the two larger lines, so that bias works against these differences.
In a camera pilot, ConductVision records the same size measures for each visible organoid, around the clock.
Limits
What is not yet validated
- Our automatic outlines on images from other microscopes, cameras or laboratories
- Shape measures, such as circularity, from our automatic outlines
- The pilot cameras' measurements, which each pilot checks against organoids measured by hand
- Readouts inside cells, such as dividing cells, in organoid images
- Toxicity calls from organoid size and shape alone
Pilots
Two ways to measure your models
- Whole organoid
24/7 camera pilot
In the pilot, cameras image your plates every 5 to 15 minutes. ConductVision tracks each visible organoid's size, growth and shape, and logs each fusion, fragmentation or structural collapse.
Plan a camera pilot - Inside cells
Analysis of your microscope images
In a pilot, ConductVision measures readouts inside cells, such as Ki67-stained dividing cells, in your lab's microscope images, and checks them against your counts.
Plan an image analysis pilot
References
- Schröter J, Deininger L, Lupse B, et al. (2024). A large and diverse brain organoid dataset of 1,400 cross-laboratory images of 64 trackable brain organoids. Scientific Data.
Check our outlines on your images
Tell us about your organoid images and the outlines or counts your lab already makes by hand.