AI hardware thermal-interface & cold-plate inspection
Review thermal-interface coverage, cold-plate channels, surface damage, and visible air-pocket candidates in AI compute hardware.
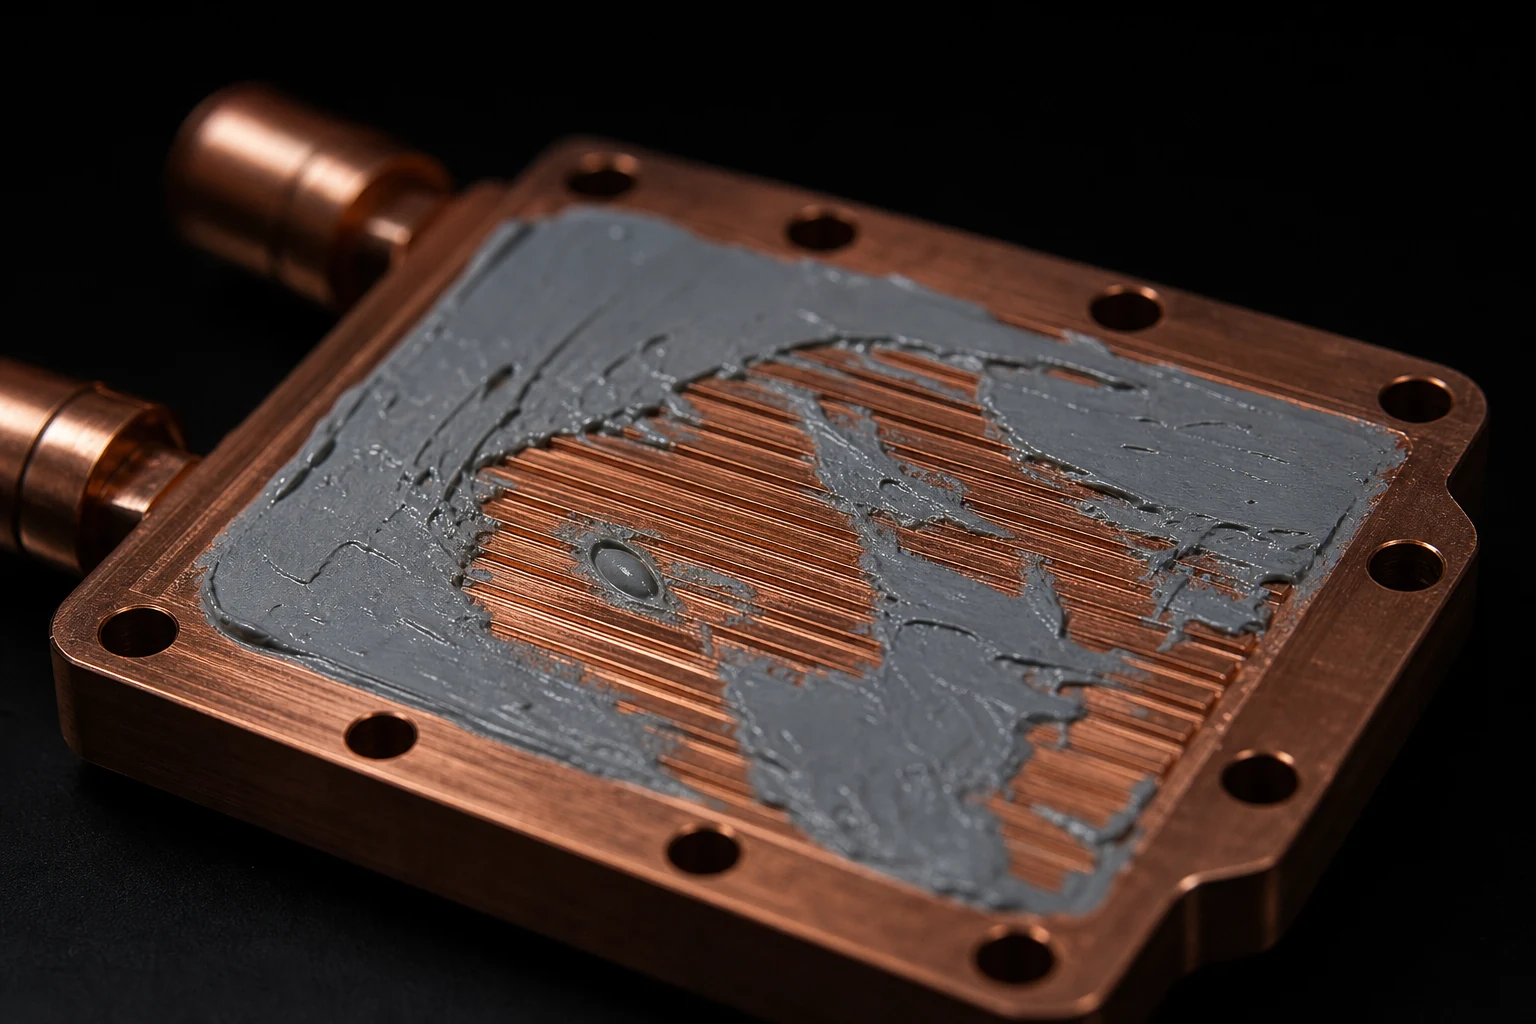
Example outputs shown for illustration. Numbers depend on your samples and protocol.
Image: Illustrative rendering (AI-generated, gpt-image-2), not an image of a specific server component
Results
Each measurement below comes from your own images, tied back to the annotated frame it came from, so results stay comparable across samples, locations, and conditions.
% area
Coverage fraction
Segmented area of the feature divided by the eligible area in the two-dimensional image.
Example, not a claimed result
In your report: Per-field value, size distribution, and the segmentation overlay used.
per area
Uncovered-area map
Findings placed in sample coordinates to reveal spatial patterns and local density.
In your report: Coordinate-referenced map, regional density, and representative images.
nm or µm
Air-pocket candidates
Perpendicular distance between the defined boundaries at each accepted measurement point.
In your report: Per-point values with median, spread, minimum, maximum, and location.
count or µm
Channel / surface findings
Visible surface features detected, measured, and located against the reviewed image.
Example, not a claimed result
In your report: Per-feature list with size, position, and annotated overlays.
Built around your image set
Use the calibrated images your team already collects, together with the locations you need to compare.
Each report includes
The artifacts your team receives, ready for review and archive.
Annotated image set
Original images with regions of interest, measurement points, masks, and finding overlays.
Measurement table
Location-indexed values, units, distributions, and QC flags in a structured export.
Method record
Calibration evidence, analysis settings, version history, and validation summary.
Confidence in every resultTraceable measurements, reviewed against your agreed reference method.
- Traceable scale
- The report records the image scale, calibration evidence, and a method-specific expanded measurement uncertainty. It does not use one product-wide accuracy number.
- Reference comparison
- The configured method is compared with your accepted reference method or reviewed annotations, and reports bias by measurement range and image condition.
- Detection performance
- Detections are evaluated against reviewed reference regions with precision, recall, and segmentation overlap, separated by the conditions that affect performance.
- Repeatability
- The locked protocol is rerun on the same inputs and on a defined repeat set. The review records variation from image acquisition, sampling, and analysis separately where possible.
What this result does not establish: Measures visible coverage and surface features in supplied images. Thermal resistance, coolant flow, and hardware release need controlled thermal and reliability validation.
The measurement, today
Thermal interfaces and cold plates are frequently inspected from photographs, teardown images, or one-off technician checks. Coverage defects are hard to compare consistently across assemblies.
What it costs
Coverage gaps, channel damage, and interface irregularities can complicate thermal investigation. Retained image measurements give hardware and reliability teams a common review record.
From image to reviewed result
- 1
Capture the assembly
Load macro, microscope, or thermal images of the cold plate, interface material, or associated hardware.
- 2
Define the review region
Register the die-contact, channel, and fastener regions that matter for your assembly.
- 3
Measure visible coverage
Segment coverage, exposed regions, candidate air pockets, and visible channel or surface anomalies.
- 4
Export the evidence
Create annotated images and a finding table for build, reliability, or teardown review.
Not sure this is the right measurement?
Send a representative image and your measurement goal. A ConductVision scientist will confirm whether this is the right fit, or point you to the closer workflow, before you commit to a quote.
Related applications
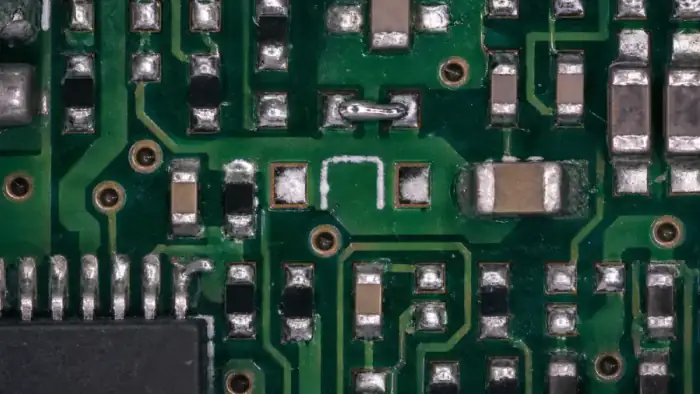
Electronics inspection
PCB and package inspection for missing, short, open, and contamination defects.
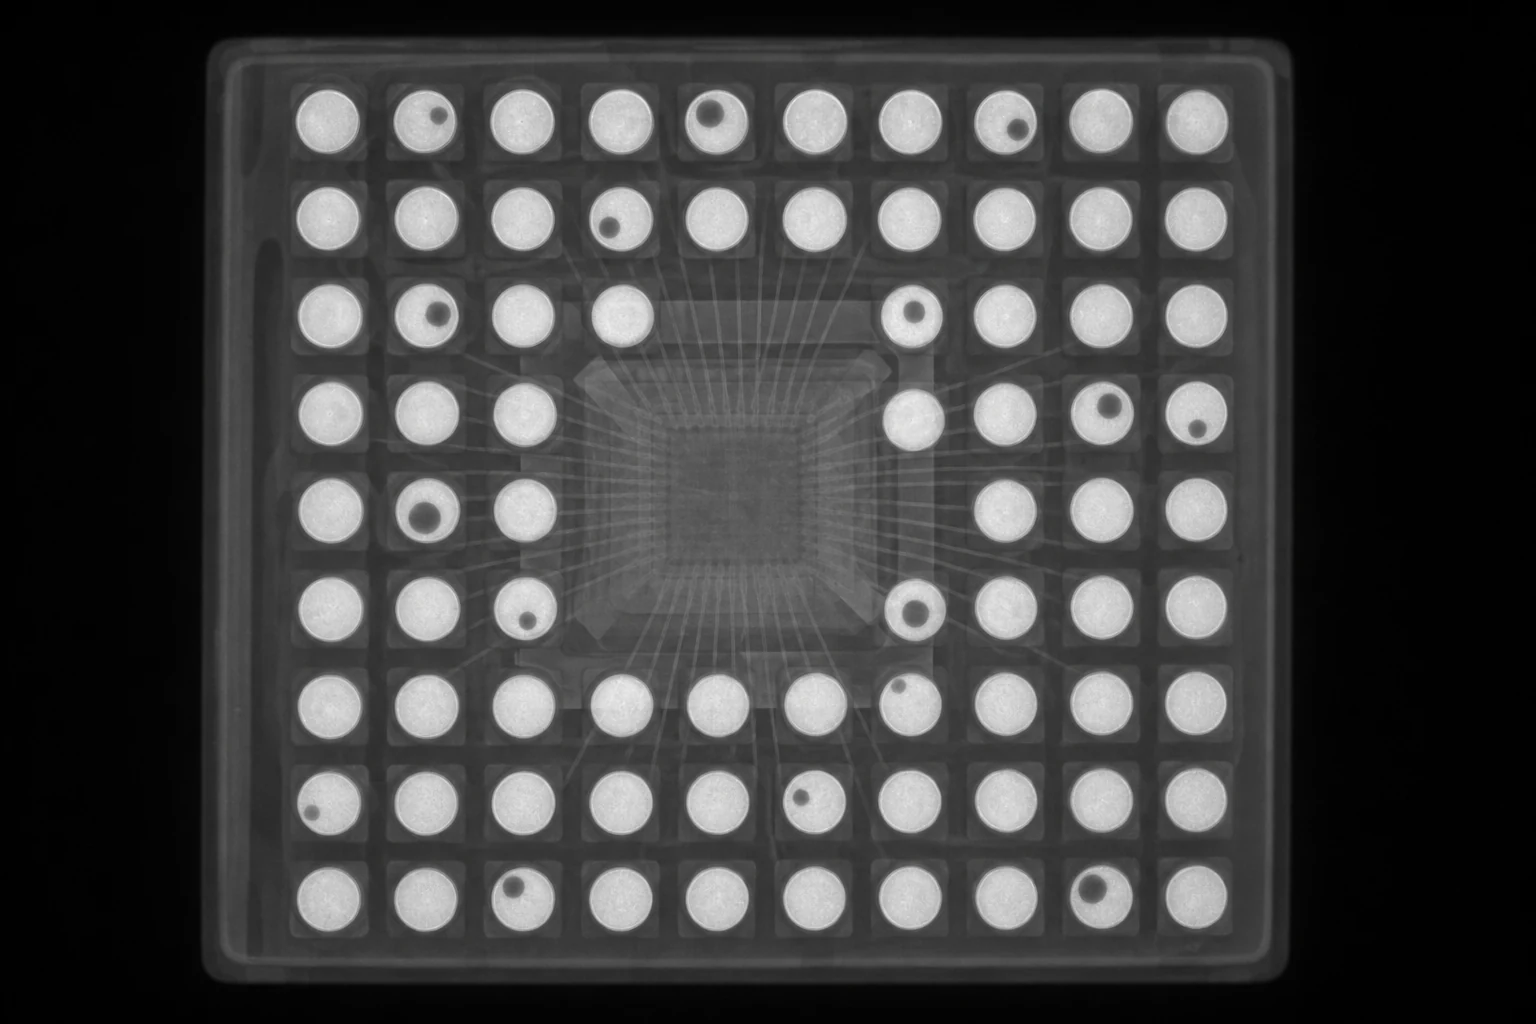
X-ray package reliability inspection
Measure solder voids, missing or offset joints, wire-bond anomalies, and internal package features from X-ray imagery.
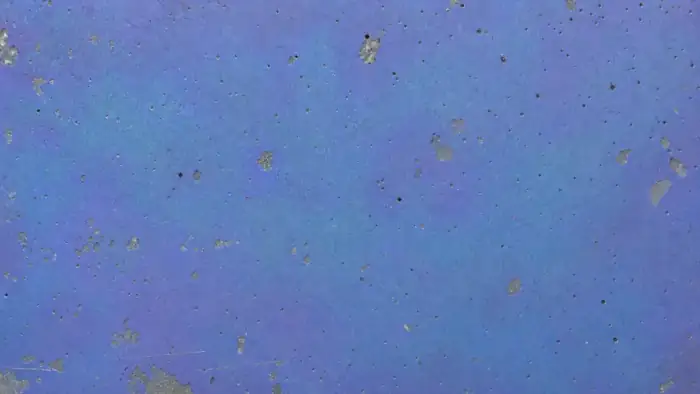
Coating & film coverage
Quantify surface coverage, holidays, and uniformity for films and thin coatings.
Send a sample image and a measurement goal
We will show the closest ConductVision workflow and flag what needs custom validation for your images.