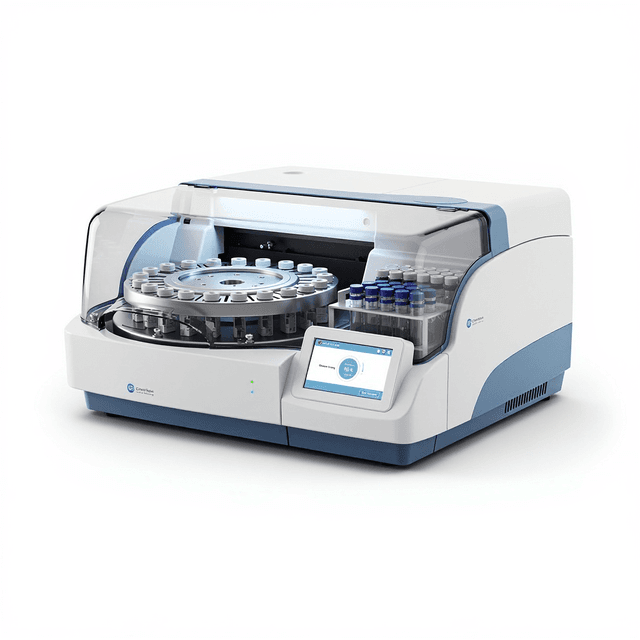
Near Infrared Nir Spectrophotometer
Precision NIR spectrophotometer with 900-2500nm range and grating monochromator for molecular analysis of organic compounds in pharmaceutical, food, and materials research applications.

Louise Corscadden, PhD
Director of Science · ConductScience
Ask Louise about Near Infrared Nir Spectrophotometer fit, setup, configuration, or quote prep.
Already working with us? Sign in to connect this with My Scientist.
Key Specifications
Full details →- Model fit
- Configured during quote
- SKU family
- BIO-0406
- Sizing
- 38.0 x 55.0 x 54.0 cm
- Ordering
- Online checkout and quote request available
- Category
- Imaging & Analysis
- Build notes
- Confirm accessories, station layout, and support needs before purchase
The Near Infrared NIR Spectrophotometer is a precision analytical instrument designed for quantitative and qualitative analysis of organic compounds and chemical constituents in the 900-2500nm wavelength range. This grating monochromator-based system provides researchers with high-resolution spectral data for molecular identification, concentration determination, and structural analysis of samples containing C-H, N-H, and O-H bonds commonly found in pharmaceuticals, polymers, food matrices, and biological materials.
The instrument features wavelength accuracy of ±0.2nm with reproducibility of ±0.05nm, enabling reliable spectral measurements for research applications requiring precise molecular characterization. Standard quartz sample cells accommodate both standard (1cm) and micro (2mm) sample volumes, while the USB interface provides direct data transfer to laboratory information systems for streamlined analytical workflows.
How It Works
Near infrared spectroscopy operates on the principle that organic molecules absorb NIR radiation at specific wavelengths corresponding to overtones and combination bands of fundamental C-H, N-H, O-H, and C=O vibrational modes. When NIR light passes through a sample, molecules absorb energy at characteristic wavelengths, creating a unique spectral fingerprint that correlates with molecular structure and concentration.
This instrument employs a grating monochromator optical system to disperse polychromatic NIR light into its component wavelengths. The monochromator scans across the 900-2500nm range with 8nm intervals, measuring transmitted or reflected light intensity at each wavelength. The resulting absorbance spectrum provides quantitative and qualitative information about sample composition through comparison with reference spectra or calibration models.
Data acquisition occurs through USB interface connectivity, enabling real-time spectral collection and transfer to analysis software for chemometric processing, peak identification, and concentration calculations based on Beer-Lambert law relationships.
Features & Benefits
Automation Level
- semi-automated
Optical System
- Grating monochromator
Wavelength Scanning Interval
- 8nm
Wavelength Range
- 900~2500nm
Wavelength Accuracy
- ≤0.2nm
Wavelength Reproducibility
- ≤0.05nm
Stray Light
- ≤0.1%
Scanning Time
- 1 minute or adjustable
Noise
- ≤0.0005Abs
Interface
- USB
Standard Accessories
- 2*1cm quartz square sample cell, 2*2mm quartz micro sample cell
Optional Accessories
- Laptop
Packing Size(W*D*H)
- 550*540*380mm
Brand
- ConductScience
Research Domain
- Analytical Chemistry
- Clinical Diagnostics
- Environmental Monitoring
- Food Science
- Materials Science
- Pharmaceutical QC
Power/Voltage
- AC110~240V, 50/60Hz
Weight
- 12kg
Weight
- 12.0 kg
Dimensions
- L: 38.0 mm
- W: 55.0 mm
- H: 54.0 mm
| Feature | This Product | Typical Alternative | Advantage |
|---|---|---|---|
| Wavelength Range | 900-2500nm coverage | Entry-level models often limited to 1100-2100nm range | Extended range enables analysis of additional organic functional groups and improved method versatility |
| Wavelength Accuracy | ±0.2nm accuracy with ±0.05nm reproducibility | Basic instruments commonly offer ±0.5-1nm accuracy specifications | Higher accuracy supports reliable peak identification and quantitative method validation |
| Optical System | Grating monochromator design | Filter-based systems or single-wavelength instruments | Monochromator provides continuous wavelength scanning and better spectral resolution for method development |
| Sample Cell Options | Dual path length cells (1cm and 2mm) | Single path length configurations in basic models | Multiple path lengths accommodate different sample concentrations and volumes without dilution requirements |
| Stray Light Performance | ≤0.1% stray light specification | Entry-level systems often specify 0.5-1% stray light levels | Lower stray light improves baseline stability and measurement accuracy in complex matrices |
This NIR spectrophotometer combines extended wavelength coverage with high accuracy specifications and grating-based optical design. The dual sample cell configuration and low stray light performance support versatile analytical applications requiring precise spectral measurements.
Practical Tips
Perform wavelength accuracy verification monthly using polystyrene or rare earth oxide standards to ensure measurement reliability.
Why: Wavelength drift can significantly affect quantitative accuracy and method transferability between instruments.
Clean quartz sample cells with appropriate solvents and inspect for scratches or deposits that could affect optical path length.
Why: Cell contamination or damage introduces systematic errors that compromise measurement precision.
Allow 30-60 minutes warm-up time before measurements to achieve thermal equilibrium of optical components.
Why: Temperature variations affect grating position and detector response, impacting wavelength accuracy and baseline stability.
Collect multiple spectra and average results to improve signal-to-noise ratio, especially for low-concentration samples.
Why: Averaging reduces random noise and improves precision of quantitative measurements in NIR applications.
Check for air bubbles in liquid samples and ensure proper cell filling to avoid spectral artifacts.
Why: Air bubbles create scattering effects that distort absorption spectra and reduce measurement accuracy.
Use appropriate personal protective equipment when handling organic solvents for sample preparation and cell cleaning.
Why: Many NIR-active compounds and cleaning solvents present health hazards requiring proper laboratory safety protocols.
Develop and validate multivariate calibration models using representative sample sets covering the expected concentration range.
Why: Robust calibration models are essential for accurate quantitative analysis in complex sample matrices using NIR spectroscopy.
Setup Guide
What’s in the Box
- NIR Spectrophotometer main unit
- Two 1cm quartz square sample cells
- Two 2mm quartz micro sample cells
- USB cable for computer connectivity
- Power cable with international adapters
- User manual and software CD
- Calibration certificate (typical)
- Sample holder assembly (typical)
Warranty
ConductScience provides a one-year manufacturer warranty covering defects in materials and workmanship, with technical support for software installation and method development assistance.
Compliance
What sample types and volumes can be analyzed with this NIR spectrophotometer?
The instrument accommodates liquid and solid samples using the included 1cm quartz cells for standard volumes and 2mm micro cells for limited sample quantities. Sample preparation may require dilution or specific sample handling depending on optical density and matrix effects.
How does the 8nm wavelength scanning interval affect spectral resolution?
The 8nm scanning interval provides adequate resolution for most quantitative NIR applications while maintaining reasonable acquisition times. This resolution is suitable for broad absorption band analysis typical of NIR overtone and combination bands.
What calibration and validation procedures are required for quantitative analysis?
Quantitative applications require development of multivariate calibration models using reference standards with known concentrations. Regular wavelength accuracy verification and baseline correction are essential for maintaining measurement reliability.
Can this instrument perform transmission and reflectance measurements?
The standard configuration supports transmission measurements through the sample cells. Reflectance capabilities would require additional optical accessories - consult product datasheet for available reflectance options.
What data formats are supported for spectral export and analysis?
USB connectivity enables data transfer to computers, though specific file formats and software compatibility should be confirmed with the supplied analysis software documentation.
How does this compare to FTIR spectroscopy for organic compound analysis?
NIR spectroscopy offers faster measurements and simpler sample preparation compared to FTIR, but provides primarily quantitative rather than detailed structural information due to the nature of overtone and combination bands.
What maintenance procedures are required to maintain performance specifications?
Regular cleaning of optical surfaces, wavelength calibration verification, and baseline correction are essential. The instrument should be kept in a controlled environment to maintain the specified accuracy and reproducibility.
Have a question about this product?
Have a question? Just ask.
Send it over and we'll email you a personalized answer — no call, no scheduling.
Prefer to talk it through?
Accessories
Enhance your setup with compatible accessories