ConductVision Disease and Toxicity Models
Repeat expansion disorders in cells and organoids
A ConductVision pilot counts RNA foci, repeat protein aggregates and DNA damage foci in your images, and reads any drop in foci with cell counts and your splicing data.
Readouts
Repeat expansion readouts and the images they need
| Readout | Level | Image needed | Evidence today |
|---|---|---|---|
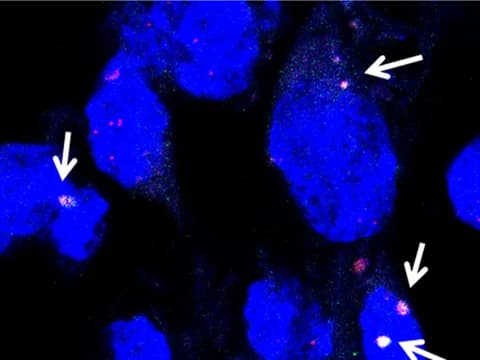
| Nuclear RNA foci | Inside cells | Microscope, RNA FISH | In neurons converted directly from DM1 skin fibroblasts, most nuclei carried RNA foci.1 In cortical organoids grown from DM1 stem cells, CUG foci appeared early in maturation.2 Neurons and astrocytes in neuromuscular organoids grown from C9orf72 ALS stem cells carried RNA foci.3Nuclear and RNA foci analysis |
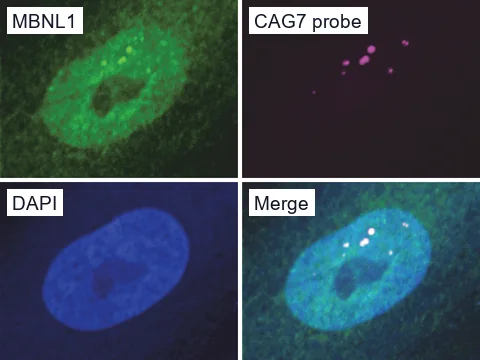
| MBNL1 sequestered in RNA foci | Inside cells | Microscope, RNA FISH with MBNL1 immunostaining | In DM1 fibroblasts, MBNL1 colocalizes with RNA foci, though some antibodies show it more clearly than others.4 |
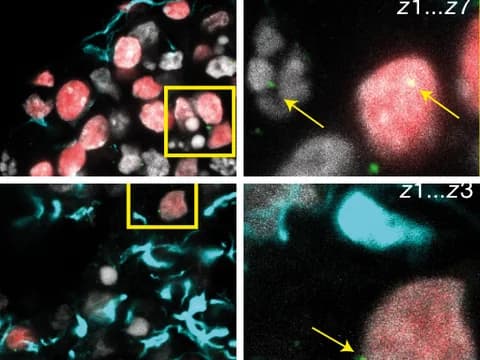
| Dipeptide-repeat proteins | Inside cells | Microscope, immunostained sections | In brain organoid slices from C9orf72 lines, deep-layer neurons accumulated the dipeptide-repeat protein poly(GA).5 C9orf72 neuromuscular organoids also carried dipeptide-repeat proteins.3 |
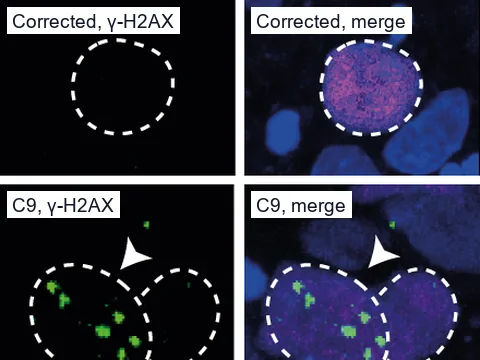
| DNA damage foci | Inside cells | Microscope, γ-H2AX immunostaining | Deep-layer neurons in the C9orf72 organoid slices accumulated γ-H2AX foci, a marker of DNA damage.5 |
| Pyknotic nuclei | Inside cells | Microscope, nuclear stain | C9orf72 organoid slices had more pyknotic neurons than controls, with no such increase in astrocytes.5 |
| Splicing | Not imaging | RT-PCR or sequencing | DM1 neurons showed aberrant splicing of MBNL1, MBNL2, MAPT, CSNK1D and MPRIP.1 |
Myotonic dystrophy
Myotonic dystrophy type 1 (DM1)
Myotonic dystrophy type 1 (DM1) is an inherited, multisystem disorder caused by an expanded CTG repeat in the 3' untranslated region of the DMPK gene.2 Genetic testing of newborn blood spots from New York State put its prevalence at 1 in every 2,100 births.6
The expanded repeat is transcribed into CUG repeat RNA, which stays in the nucleus as foci that sequester MBNL proteins, which regulate alternative splicing of other genes.1
Myotonic dystrophy
Choosing an MBNL1 antibody
Aoki and colleagues compared six commercial MBNL1 antibodies by RNA FISH and immunofluorescence in DM1 fibroblasts.4 Two of the antibodies showed strong colocalization with RNA foci, and two others showed none.4
A pilot that measures MBNL1 in foci would first test your antibody on DM1 cells with known foci.
Myotonic dystrophy
Myotonic dystrophy type 2 (DM2)
Myotonic dystrophy type 2 (DM2) is caused by an expanded CCTG repeat in intron 1 of the CNBP gene.7 Neural progenitor cells made from DM2 stem cells kept the expansion and nuclear RNA foci that sequestered MBNL1.7 In the stem cells themselves, foci appeared in 100% of DM2 cells and in none of the wild-type cells.7
A DM2 pilot would use the same foci and MBNL1 measures, with a FISH probe for the CCUG repeat.
C9orf72 ALS/FTD
The C9orf72 repeat and its organoid models
An expanded GGGGCC repeat in the C9orf72 gene is the most common genetic cause of amyotrophic lateral sclerosis (ALS) and frontotemporal dementia (FTD).8
Lee and colleagues found that expressed repeats of 38 and 72 units formed nuclear RNA foci that set off apoptotic cell death in neuronal cell lines and zebrafish embryos.9 Long, hairpin-forming repeats can also be translated into repeat proteins without an ATG start codon, a process called RAN translation.10
Szebényi and colleagues grew cerebral organoids from C9orf72 and control stem cells and cultured them as slices that recapitulate mature cortical architecture.5 Gao and colleagues grew neuromuscular organoids, with spinal cord and muscle tissue, from C9orf72 ALS stem cells and isogenic controls.3
C9orf72 ALS/FTD
DNA damage foci and pyknotic nuclei
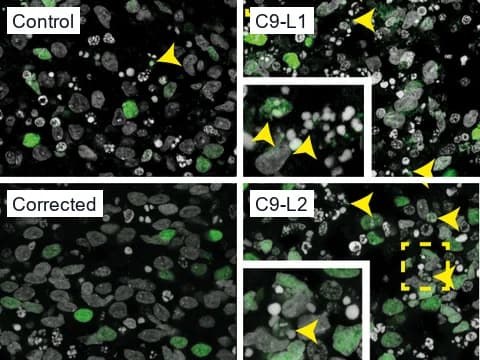
In the C9orf72 slices, GSK2606414 also reduced γ-H2AX foci and pyknosis in deep-layer neurons.5 The authors measured γ-H2AX foci in confocal stacks with CellProfiler, imaging every section at the same settings.5
C9orf72 ALS/FTD
Cutting out the repeat lowered RNA foci in mouse neurons
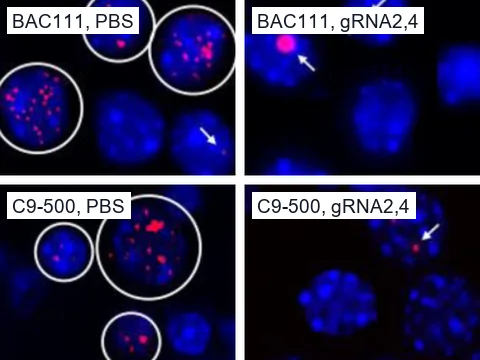
Meijboom and colleagues used CRISPR/Cas9 to cut the repeat expansion out of two models: brain organoids from patient stem cells carrying 450 repeats, and mouse primary neurons carrying the human expansion.8 In the mouse neurons, the share of nuclei with RNA foci fell from 64% to 16%, counted by hand in more than 300 cells per slide.8
Compounds
A drop in foci is not a rescue
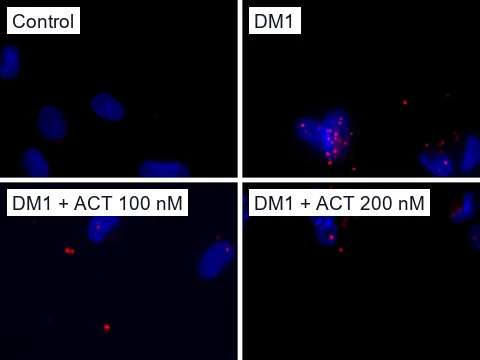
In DM1 neurons converted from skin fibroblasts, Eltahir and colleagues found that actinomycin D, a potent transcription inhibitor, cut foci per nucleus by 56% at 100 nM and 66% at 200 nM.1,11 They saw some cell toxicity at 200 nM.1
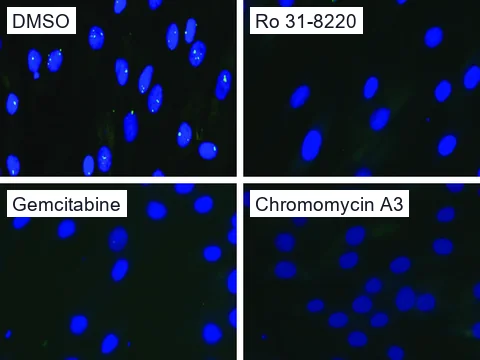
In a high-content screen of DM1 and DM2 fibroblast lines, Ro 31-8220 and chromomycin A3 reduced or removed nuclear foci.12 Chromomycin A3 binds G-C base pairs and inhibits RNA synthesis.12 Gemcitabine and hypericin also cleared foci, but their toxicity tracked the loss of foci.12 Even where foci disappeared, the repeat RNA stayed in the nucleus.12
In a preprint on 3D engineered muscle from DM1 myoblasts, phenylbutazone reduced RNA foci and MBNL1 sequestration but did not restore splicing or muscle function.13
In C9orf72 models, a pilot reads RNA foci and repeat proteins side by side, since a compound could lower one without the other.
Our check
Our spot detector on published DM1 images, and its benchmark
In a 2D cell-image check, we ran our spot detector without tuning on one published image per condition from Eltahir and colleagues.1 It found 1.94 foci per nucleus across 16 DM1 nuclei and none across 9 control nuclei. Counting by hand across 324 nuclei per sample, the authors found 3.82 per DM1 nucleus, so the detector undercounts.1
On the same single images, foci per nucleus fell 71 percent after 200 nM actinomycin D (95 percent interval, 17 to 91 percent), close to the authors' figure. At 100 nM they fell 48 percent, but the 95 percent interval of that change crosses zero, so one image cannot separate it from no change. We also ran the detector on Ketley and colleagues' published DM1 fibroblast images.12 In one field per compound, it counted 21 foci after DMSO, 1 after Ro 31-8220 and none after gemcitabine or chromomycin A3.
We scored the detector on DNA damage foci, in 90 γ-H2AX images of irradiated human lymphocytes that were not used to set it up. It found 75 percent of the foci experts had marked, and 84 percent of its detections were marked foci (F1 0.79). We have not scored the settings we ran on these DM1 images. No score exists for RNA foci or organoid images, so a pilot first checks its counts against your own.
Pilot
What a pilot measures
- 1
Foci in each nucleus
ConductVision counts RNA foci per nucleus in your FISH images, with their brightness and area and the share of nuclei with foci.
- 2
MBNL1 in the foci
In DM1 models, a pilot would measure the share of nuclear MBNL1 inside foci, from a second fluorescence channel.
- 3
Repeat proteins
A C9orf72 pilot counts dipeptide-repeat protein aggregates around each nucleus in your immunostained sections.
- 4
Cell counts
Counting the nuclei in each field shows whether a drop in foci came with a loss of cells.
- 5
Splicing, from your lab
Splicing comes from your RT-PCR or sequencing, outside what ConductVision measures.
- 6
Controls
A pilot would include actinomycin D as a control that lowers foci by blocking transcription.
- 7
One DM1 result from four measures
A DM1 pilot reports a rescue when foci and MBNL1 sequestration fall, splicing improves and cell counts hold. If data on any one of the four is missing, the pilot reports no result.
Pilots
Two ways to measure your models
- Whole organoid
24/7 camera pilot
In the pilot, cameras image your plates every 5 to 15 minutes. ConductVision tracks each visible organoid's size, growth and shape, and logs each fusion, fragmentation or structural collapse.
Plan a camera pilot - Inside cells
Analysis of your microscope images
In a pilot, ConductVision measures readouts inside cells, such as RNA foci per nucleus, in your lab's microscope images, and checks them against your counts.
Plan an image analysis pilot
References
- Eltahir MK, Nakamori M, Hattori S, et al. (2022). Pharmacotherapy alleviates pathological changes in human direct reprogrammed neuronal cell model of myotonic dystrophy type 1. PLOS ONE.
- Morelli KH, Jin W, Shathe S, et al. (2022). MECP2-related pathways are dysregulated in a cortical organoid model of myotonic dystrophy. Science Translational Medicine.
- Gao C, Shi Q, Pan X, et al. (2024). Neuromuscular organoids model spinal neuromuscular pathologies in C9orf72 amyotrophic lateral sclerosis. Cell Reports.
- Aoki Y, Ohki A, Yanaizu M, et al. (2025). Comparative Analysis of MBNL1 Antibodies: Characterization of Recognition Sites and Detection of RNA Foci Colocalization. Genes.
- Szebényi K, Wenger LMD, Sun Y, et al. (2021). Human ALS/FTD brain organoid slice cultures display distinct early astrocyte and targetable neuronal pathology. Nature Neuroscience.
- Johnson NE, Butterfield RJ, Mayne K, et al. (2021). Population-Based Prevalence of Myotonic Dystrophy Type 1 Using Genetic Analysis of Statewide Blood Screening Program. Neurology.
- Spitalieri P, Talarico RV, Murdocca M, et al. (2018). Generation and Neuronal Differentiation of hiPSCs From Patients With Myotonic Dystrophy Type 2. Frontiers in Physiology.
- Meijboom KE, Abdallah A, Fordham NP, et al. (2022). CRISPR/Cas9-mediated excision of ALS/FTD-causing hexanucleotide repeat expansion in C9ORF72 rescues major disease mechanisms in vivo and in vitro. Nature Communications.
- Lee YB, Chen HJ, Peres JN, et al. (2013). Hexanucleotide Repeats in ALS/FTD Form Length-Dependent RNA Foci, Sequester RNA Binding Proteins, and Are Neurotoxic. Cell Reports.
- Zu T, Gibbens B, Doty NS, et al. (2011). Non-ATG-initiated translation directed by microsatellite expansions. Proceedings of the National Academy of Sciences.
- Siboni RB, Nakamori M, Wagner SD, et al. (2015). Actinomycin D Specifically Reduces Expanded CUG Repeat RNA in Myotonic Dystrophy Models. Cell Reports.
- Ketley A, Chen CZ, Li X, et al. (2014). High-content screening identifies small molecules that remove nuclear foci, affect MBNL distribution and CELF1 protein levels via a PKC-independent pathway in myotonic dystrophy cell lines. Human Molecular Genetics.
- Fernández-Garibay X, Sabater-Arcís M, Tejedera-Villafranca A, et al. (2026). Patient-derived 3D engineered human muscle model recapitulates CLCN1 mis-splicing and myotonia in myotonic dystrophy type 1. bioRxiv (preprint).
Plan a repeat expansion pilot
Tell us your disease model, the compounds you test and the readouts you need.