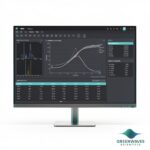
Comprehensive Windows-based software suite for NMR relaxation data analysis, featuring T1-T2 correlation mapping, crosslink density measurement, and diffusion analysis capabilities.
The NMR Analysis Software Suite is a comprehensive research platform designed for NMR relaxation data analysis across the complete experimental workflow. The software provides capabilities for ultrashort relaxation (T2) analysis, 2D T1-T2 relaxation correlation mapping, and layered T-distribution analysis, enabling researchers to extract detailed molecular dynamics information from NMR measurements.
Built for Windows 10/11 environments with per-instrument licensing, the suite integrates method setup, data acquisition control, processing algorithms, and result output into a unified platform. The software supports crosslink density measurements, double quantum (DQ) experiments, and diffusion coefficient determination, making it suitable for materials characterization, polymer analysis, and molecular structure studies.
The software processes NMR relaxation data by analyzing the decay characteristics of nuclear magnetization following radiofrequency pulse sequences. T1 (longitudinal) and T2 (transverse) relaxation measurements provide information about molecular motion and local environments, with faster relaxation rates typically indicating restricted molecular mobility or paramagnetic interactions.
For 2D T1-T2 correlation analysis, the software applies inverse Laplace transform algorithms to generate relaxation distribution maps that reveal distinct molecular populations. Ultrashort T2 analysis captures rapidly relaxing components using specialized pulse sequences, while double quantum experiments probe molecular orientation and dynamics through coherence pathway selection. Diffusion measurements utilize pulsed field gradient sequences to determine molecular translation rates.
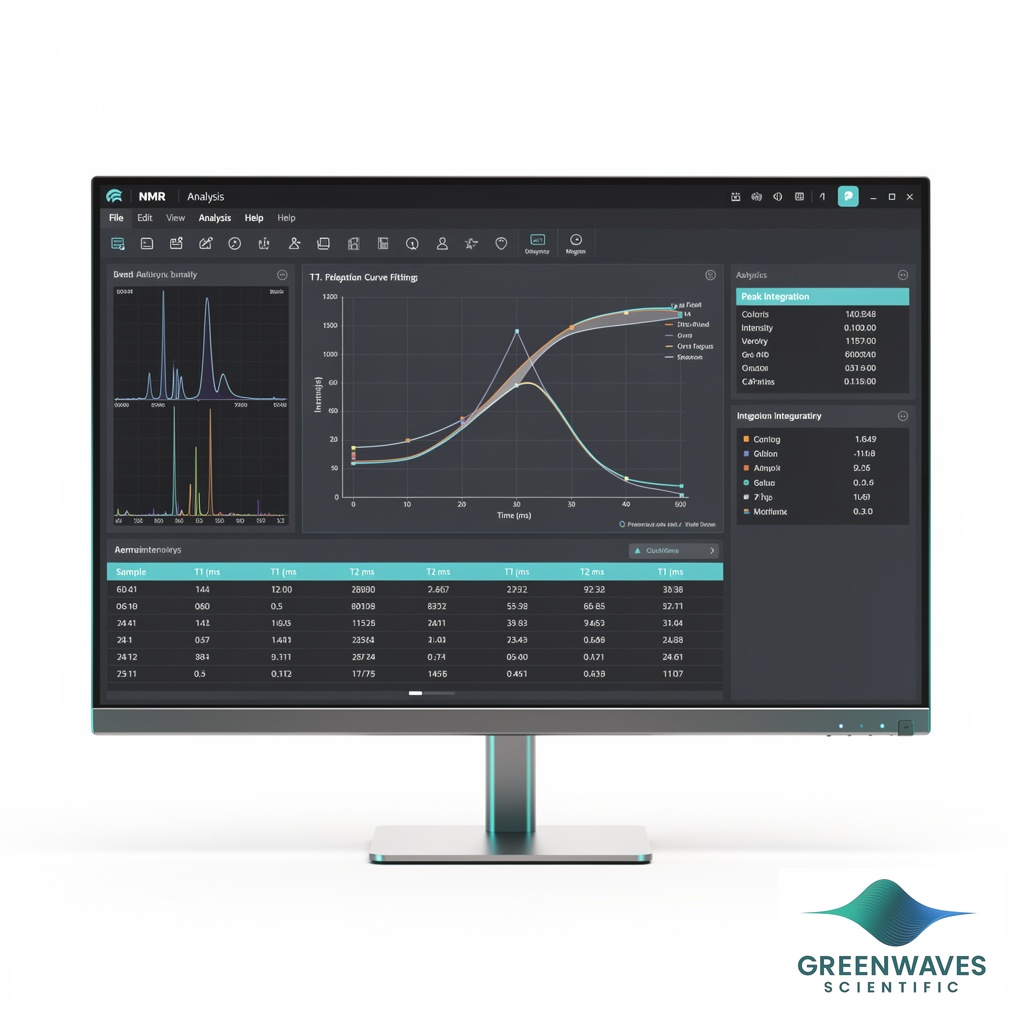
The integrated workflow processes raw time-domain data through phase correction, baseline adjustment, and noise filtering before applying relaxation fitting algorithms. Results are displayed as distribution plots, correlation maps, and quantitative parameter tables for interpretation and export.
| Feature | This Product | Category Context |
|---|---|---|
| Platform Compatibility | Windows 10/11 native operation | Cross-platform solutions may have limited OS-specific optimization |
| Licensing Model | Per-instrument licensing | Site-wide or user-based licensing models vary by vendor |
| Analysis Capabilities | Integrated T1-T2 correlation mapping with ultrashort T2 analysis | Basic packages often focus on single relaxation parameter fitting |
| Workflow Integration | Complete platform from method setup to result output | Separate acquisition and processing software require file transfer steps |
This Windows-based platform provides comprehensive NMR relaxometry analysis with advanced 2D correlation mapping and ultrashort relaxation capabilities. The per-instrument licensing and integrated workflow design optimize efficiency for dedicated NMR analysis workstations in research and quality control environments.
Validate analysis algorithms using reference standards with known relaxation parameters before processing experimental samples.
Ensures accurate quantitative results and identifies any systematic processing errors.
Regularly backup method templates and processing parameters to prevent configuration loss during system updates.
Maintains analytical consistency and reduces method redevelopment time after software updates.
Process replicate measurements to assess data quality before applying complex multi-dimensional analysis algorithms.
Identifies acquisition problems that could compromise advanced analysis results and ensures statistically meaningful outcomes.
Monitor signal-to-noise ratios in raw data before proceeding with ultrashort T2 or correlation analysis.
Low SNR data can produce artifacts in advanced processing algorithms, leading to incorrect molecular population assignments.
Verify instrument communication settings if data acquisition fails or produces incomplete datasets.
Communication errors can cause partial data transfer that may not be immediately apparent but affects analysis quality.
Document analysis parameters and method settings for each sample type to ensure reproducible processing protocols.
Enables method transfer between users and provides audit trail for quality control applications.
ConductScience provides a standard one-year manufacturer warranty covering software defects and technical support. Extended support packages are available for ongoing method development and training assistance.
The following papers provide general scientific background on measurement techniques relevant to this product category. They are not validation studies of this specific instrument.
What types of NMR relaxation experiments can the software analyze?
The software processes T1 longitudinal relaxation, T2 transverse relaxation including ultrashort components, 2D T1-T2 correlation data, double quantum experiments, and diffusion measurements. Consult product documentation for specific pulse sequence compatibility.
How does the 2D T1-T2 correlation analysis work?
The software applies inverse Laplace transform algorithms to generate correlation maps showing the relationship between T1 and T2 relaxation times, enabling separation of molecular populations with different dynamics and local environments.
What is the minimum system requirement for data processing?
The software requires Windows 10 or 11 with per-instrument licensing. Specific RAM, storage, and processor requirements depend on dataset size and should be confirmed from the technical specifications.
Can the software handle multi-component relaxation analysis?
Yes, the layered T-distribution analysis feature processes complex systems with overlapping relaxation behaviors, providing detailed distribution information for each component.
How is crosslink density calculated from NMR data?
The software uses relaxation-based analysis methods to determine polymer network structure, though specific algorithms and calibration procedures should be verified in the method documentation.
What data formats does the software accept for processing?
The software integrates with compatible NMR hardware systems for direct data acquisition. Supported file formats for imported data should be confirmed from the technical specifications.
Is method validation support included with the software?
The software includes sample datasets for validation testing and method development guidance. Training and ongoing technical support are available through ConductScience.