From Rodent Tracks to Human Steps: Why We Need a Common Language for Movement Data

Introduction
Quantitative gait analysis is considered a keystone for diagnosis and development of therapies for neurological disorders —including Parkinson’s disease (PD), Huntington disease (HD), and spinal cord injury (SCI) —because it provides objective, reliable and rater-independent measures of mobility.1 Brain damage often results in impairment in gait and balance. These impairments are a leading cause of morbidity, mortality, and disability in both central and peripheral neurologic disorders. Therefore, gait analysis has a pivotal role during rehabilitation course of subjects suffering from neurological disorders.2
Rodent models are used extensively in preclinical gait research to study neuromuscular disease and to test new treatments. As a result, large amounts of quantitative gait analysis data are routinely generated in animal model studies with the expectation that they will be used to study human locomotory functions and diseases. Although rodent models have a pivotal role in novel therapy development and testing, treatment modalities succeeding in preclinical studies on rodent models frequently fail human trials. The experimental translation trials fail either due to inconsistent experimental design or due to anatomical and physiological differences between rodent and humans.3
The key contributor to this translational gap is the difficulty in comparing the gait metrics across species directly. Metrics such as stride length, stride frequency, and walking speed, change strongly with body size.4Consequently, direct comparison of numerical data on gait functions between humans and rodents is often misleading, as it only reflects the differences in limb length and temporal scale instead of similarities or differences in neural motor control.
At initial glance, a mouse scurrying through a maze and human walking in a park may seem to be operating at totally different spatial and temporal scales and yet, despite these differences, the principles that govern movement — such as balance, coordination, and energy efficiency— are conserved deeply among species. This phenomenon is often described as mechanical similarity which suggests that animals of different sizes follow the same underlying laws of physics even when their locomotion seems very different.5
This raises a fundamental question in neuroscience and biomechanics: how can rodent gait metrics be represented in a way that meaningfully corresponds to human gait data? To address this question, it requires moving beyond measurements expressed in centimeters and seconds toward dimensionless, scale-independent representations of movement.
Problem Statement: Cross Species limitations of Raw Gait Metrics
Most gait metrics — such as stride length, stride frequency, and speed — scale strongly with body size. As a result, direct conversion of raw measurements across species can be misleading. For example, a mouse may take eight steps per second while a human takes two; however, this does not mean mice are four times more coordinated. It simply reflects the fact that mice have much shorter limbs showing a difference in limb length and not in coordination. Therefore, raw metrics alone fail to provide a normalized comparison basis across species.
Body size governs basic gait parameters
Across mammals, stride frequency decreases with increasing body size, while stride length increases. Smaller animals take more steps per second; larger animals take fewer but longer steps to cover the same distance. This pattern is a common understanding that longer limbs covers greater distance per stride, reducing the need for increased frequency.[7]
This relationship has been repeatedly demonstrated in both experimental and comparative studies.[7] Analyzing locomotion across mammals spanning orders of magnitude in mass, showed that stride frequency scales inversely(decreases) with increasing body mass, while stride length scales positively. Similar patterns have been observed in rodents and humans — essential for minimizing the cost of transport, limb length acts as the dominant mechanical parameter (locomotion costs and kinematics) rather than neural coordination.
Put differently, as animal size increases, there is a systematic shift in gait parameters — adopting to the understanding that longer strides require lower stride frequencies — to maintain efficient locomotion. These adjustments allow animals of various sizes to move economically despite large differences in absolute speed and cadence.
Gait pattern further modulates scaling
Gait type matters as well. As transition between gaits —Walking, trotting, and galloping— occurs on a regular basis based on footfall patterns, limb contact times, and force distribution, influencing how stride parameters scale with speed and size. Importantly,despite differences in patterns of footfall and distribution of force, the scaling relationships (such as how stride frequency and stride length increase with speed and decrease with size) remain consistent across different gaits.
While animals transition between gaits at different absolute speeds —they do so at similar relative (size-scaled) speeds— and the energetic cost per stride (per unit body mass) remains remarkably constant across species. Thus, although gait changes the mechanics, it does not invalidate the fundamental size-dependent relationships.[7]
How animals increase speed depends on size
Beyond size alone, species differ in how they regulate speed. [9] demonstrated that animals use distinct mechanical properties in order to regulate speed based on their body mass and posture. The slope of speed versus stride length is inversely proportional to body mass. For small-bodied species, even minor increases in stride length can lead to rapid increases in speed whereas larger species must increase their stride length substantially to achieve comparable speed changes.
Their phylogenetic analysis further showed that small, crouched animals (such as rodents) tend to increase speed by increasing stride frequency, whereas larger, erect-limbed species rely heavily on increasing stride length to accelerate. This distinction explains why raw comparisons of cadence or stride length across species can be misleading as different animals use fundamentally different mechanical strategies to accelerate.
Why raw values fail for cross-species comparison
This mismatch between raw gait values (such as absolute speed and stride-frequency) and underlying mechanics has been a major problem in comparative locomotion research for decades. As [7] emphasized, comparing absolute stride frequency, speed, or stride length across species conceals the true similarities in locomotor control and energetics.
If we rely solely on raw numbers, cross-species comparisons become almost meaningless—a mouse appears “hyperactive” and a larger animal “sluggish — in reality both may be moving at equivalent relative speeds and energetic optima.
The solution: Dimensionless, size-independent metrics
The solution is elegant and now well established, converting raw gait variables into normalized, dimensionless metrics. By scaling speed to leg length and gravity (e.g., the Froude number), or expressing stride length relative to limb length or body size, gait data from different species fall onto shared curves.
Human studies show that when we express stride length and speed in relative terms, differences between children and adults largely disappear. Rodent gait analysis similarly normalizes parameters to body or limb length allowing meaningful interpretation. These approaches reveal that, despite the presence of dramatic differences in raw values, the underlying control principles of locomotion are conserved across mammals.
In short, dimensionless measures allow gait data obtained from mice and human studies to speak the same language thus, transforming raw metrics into biologically meaningful comparisons.
Dimensionless Metrics: The Secret to Cross-Species Comparability
Biomechanical and metabolic parameters such as speed, force, energy use, etc. vary with body mass and do not directly translate across species. For example, Kleiber’s law shows that basal metabolic rate scales to the 3/4 power of body mass (Mass^0.75), sThis means a 10,000× heavier animal uses only ~1,000× more energy.[11] Thus, a horse and mouse moving at the identical mass-specific speed use vastly different amounts of energy relative to their size, which makes raw comparison of velocity or oxygen consumption misleading. In gait analysis, this means raw metrics (stride length, velocity, oxygen consumption, etc.) unless scaled, are not comparable between mice and humans. Dimensionless normalization removes the effects size and mass. In particular, Dynamic Similarity Theory, as hypothesized by R. McNeill Alexander and Jayes (1983), predicts that geometrically similar animals moving at equal Froude numbers will have equivalent mass-specific locomotion patterns (they use similar amounts of energy relative to their body weight to cover a unit distance) and costs. In practice, this means using animal limb length and gravity to form scale-free metrics.
1. The Froude Number: a universal speed scale
The Froude number(Fr) is a dimensionless value in biomechanics which measures locomotor speed by comparing an animal’s forward velocity(v) to the gravitational acceleration(g) and a characteristic length, typically leg length(l). By normalizing speed to leg length and gravity, it allows dynamically similar gaits to be compared across species of different sizes. It is calculated using formula:
Fr = V² / (g · l)
where:
- V = forward speed
- g = gravitational acceleration
- l = characteristic leg (or limb) length
Under dynamic similarity, animals of different size and shape moving at the same Fr should show comparable mechanics. For geometrically similar quadrupeds walking at equal Fr, the mass-specific mechanical cost of transport (energy per mass per distance) is constant.[9] Thus, Fr can compensate for speed differences: for e.g. a mouse and an elephant have similar gait dynamics at equal Fr, despite vastly different absolute speeds.
However, humans and other animals are not perfectly geometrically similar, and variation in limb proportions alters this picture. For example, Kramer & Sarton-Miller (2008) found that Froude number did not outperform simple speed in predicting human metabolic cost – adding leg length (into Fr) did not improve the fit .[12] In fact, humans walking at the same Fr do not use identical oxygen per kilogram . Kramer & Sylvester (2013) confirmed that within-species shape differences (e.g. limb segment ratios) create substantial variation in internal work and metabolic energy even at equal Fr [13]. In short, Fr is invaluable for comparing overall gait patterns across sizes, but it cannot fully account for shape-dependent differences. It remains a keystone of cross-species gait scaling [10], but its limitations (e.g. in human shape variability) have been documented .
Gait Variability: Coefficient of Variation (CV)
In translational neuroscience, the concept of variability in movement is important because many neurological diseases do not change average gait values primarily, instead disrupt the consistency and stability of motor control, thus making variability a sensitive marker of neural dysfunction across species.
No animal walks exactly the same way with every step. Even during steady walking, stride time, step length, and limb contact timing fluctuate slightly from step to step. Gait variability describes how consistent or irregular these repeated movements are.
The coefficient of variation (CV) is the most widely used way to quantify this variability. It is calculated as:
CV = (standard deviation / mean) × 100%
Rather than measuring how big the fluctuations are in absolute terms, CV expresses them against the average value. This is essential, because a mouse’s stride time is much shorter than a human’s, and raw variability (in milliseconds or centimeters) would be meaningless to compare directly.
Why does CV work across species?
As CV is a percentage, it automatically accounts for differences in body size, limb length, and walking speed. A stride-time CV of 5% means that the timing of each step varies by about 5% around the average stride time—regardless of whether the animal is a mouse or a human.
This normalization makes CV a dimensionless, scale-free measure of gait regularity, allowing fair comparisons among species with vastly different biomechanics.
What CV tells us biologically?
Low CV values indicate a highly regular, stable gait, where the nervous system tightly controls step timing and placement.
Higher CV values reflect less precise control, which may arise from aging, neurological disease, injury, or impaired sensory feedback.
In humans, increased stride-to-stride variability has been strongly linked to:
- aging
- balance impairment,
- and increased risk of falling.
Hausdorff et al. (1997) showed that elderly individuals with higher stride-time CV were significantly more likely to experience falls, even when their average walking speed was normal.[14]
Rodent gait studies use the same principle. Modern gait analysis systems measure: stride time, step length, paw contact duration, and interlimb coordination.
CV of these parameters is routinely used to detect: ataxia, stroke-induced deficits, Parkinsonian models, spinal cord injury, and cerebellar dysfunction. Machado et al. (2015) and Herold et al. (2016) explicitly compute CV in mouse models and demonstrate that pathological conditions consistently increase gait variability—mirroring patterns seen in humans.[15]
Symmetry Indices (SI) – Left–Right Imbalance
Neurological or musculoskeletal deficits often cause one limb to lag the other. Symmetry indices are used to quantify this asymmetry. Symmetry Indices is a unitless, self-normalized measure in gait analysis used to quantify left-right limb imbalance. A common formula (Robinson et al. 1987) is:
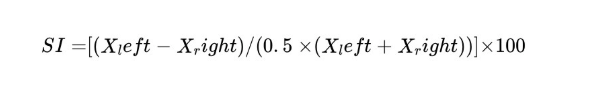
where X represents the value of a gait parameter measured for the left and right limbs (e.g., step length, stance time, or peak force).
An SI of 0% indicates perfect symmetry, while (up to ±100%) increasing positive or negative values indicate greater left–right asymmetry. For group-level analyses, absolute SI values may be used to prevent cancellation of opposing asymmetries. In practice, any left/right pair of gait metrics (e.g. swing time, force, step length) can be inserted. Robinson et al. introduced SI for stance-phase forces; Baird et al. (2006) and others have applied similar indices to rodent hindlimb data (often via pressure-plate or motion capture).[16] These indices are useful in stroke models and neurodegenerative disease: for example, a rat with unilateral injury might show a 20% SI in hindlimb stance time. The key is that SI is unitless and self-normalized. (Recent reviews note the proliferation of SI formulas but all share the feature of a left–right ratio or difference .) By expressing imbalance in percent terms, SI allows a direct human–rodent comparison: e.g. 10% asymmetry in step length in a mouse is the same relative imbalance as 10% in a human gait.
Problem Statement: Cross Species limitations of Raw Gait Metrics
Cost of Transport (COT) refers to the energy (often metabolic power) required to move a unit weight (or mass) over a unit distance. In metric form, a mass-specific COT = (energy expenditure) / (body mass × distance) (sometimes also divided by g to be fully dimensionless). Equivalently, because weight ≈ mg, COT = (metabolic power) / (weight × velocity). The critical feature is that COT normalizes energy by both mass and distance, yielding a size-free efficiency. Historically, Taylor et al. (1982) showed that for many mammals and birds running, metabolic power increases linearly with speed – implying a roughly constant COT for a given gait. [18] Similarly, Tucker (1975) and others noted that heavier animals use less energy per kilogram.[19] In fact, Alexander & Jayes (1983) found that when animals walk at equal Fr, their mechanical COT (J/kg/m) is essentially constant across sizes .[10] In other words, a geometrically scaled mouse and elephant at equal Fr have the same mass-specific mechanical work per meter . This emergent constancy under dynamic similarity is precisely why COT is a useful cross-species metric.
In practice, human studies often quote the dimensionless mass-specific metabolic COT (e.g. J·kg⁻¹·m⁻¹), which naturally accounts for body size. Combined with Fr-scaling, COT enables meaningful comparisons: a human and a chimpanzee or a human and a cat can be compared at equivalent dimensionless speeds. Any residual differences reflect true biological variance (e.g. posture, gait style), rather than trivial size effects.
Unified Picture: From Allometry to Non-Dimensional Gait
To sum up, raw gait measures (speed in m/s, stride length in cm, metabolic rate in ml O₂/min, etc.) cannot be directly compared across species of vastly different size. Allometric scaling laws (like Kleiber’s ¾-power rule ) mean that two geometrically similar animals do not simply use proportional energy or have proportional gait parameters. Dimensionless metrics solve this: they divide out the effects of leg length, gravity, body mass and inherent variability. The Froude number (Fr) handles dynamic scaling of speed ; Coefficient of Variation (CV) normalizes stride-to-stride variability ; Symmetry Indices (SI) normalize left–right differences ; and Cost of Transport (COT) normalizes energy use per mass per distance . Together, these dimensionless measures let researchers meaningfully equate a mouse’s walk to a human’s stroll or a rat’s run to a dog’s gallop. In practice, when using these metrics to compare rodents and humans, one finds that broad gait patterns and trends line up despite the size gap – for example, plotted against Fr or dimensionless speed, spatio-temporal and energetic curves for different species tend to align . By anchoring comparisons to theory (dynamic similarity, mass scaling) rather than raw values, we avoid the pitfalls of naïve cross-species extrapolation.
Sources: Authoritative scaling and gait literature were consulted for these guidelines. Notable references include Kleiber (1932) for metabolic scaling , Alexander & Jayes (1983) on dynamic similarity and Froude scaling , Kramer & Sarton-Miller (2008) and Kramer & Sylvester (2013) on human gait variability in Fr , Tucker (1975) and Taylor et al. (1982) on locomotion energetics, Hausdorff et al. (1997) on gait variability and CV , Machado et al. (2015) and Herold et al. (2016) on rodent gait variability, and Robinson et al. (1987) and Baird et al. (2006) on symmetry indices , among others. These works collectively demonstrate that dimensionless gait metrics are essential for valid rodent–human comparisons.
What Current Systems Actually Capture (DLC, ConductVision, and Others)
In order to understand why cross-species gait translation still remains difficult, it is important to differentiate what the current computer-vision and motion-tracking systems are actually measuring, and how (or whether) those measurements overlap between animal and human studies. Most modern systems are technically complex, but they operate at different levels of abstraction (ranging from raw coordinates to high-level biomechanics) and rarely align their outputs across species.
What should a universal translational output look like?
A truly cross-species gait system should export a small set of standardized, dimensionless metrics that do not vary with respect to body size and species. At minimum, this includes:
- Dimensionless speed (e.g., Froude-scaled velocity)
- Normalized stride parameters (stride length / limb length),
- Gait stability (CV of stride time and step length),
- Left–right symmetry (standardized SI),
- Energetic efficiency (mass-specific cost of transport),
- Metadata describing limb definitions and posture assumptions.
Such an output layer allows rodent and human datasets to be compared directly, regardless of the upstream tracking method used to generate them.
DeepLabCut (DLC)
What does it do?
DeepLabCut is a widely used, open-source, markerless pose-estimation framework that tracks user-defined body points in video data using deep learning.[20] It is highly flexible and has been successfully applied to rodents, fish, insects, primates, and humans.
What does it output?
DLC produces:
- 2-D or 3-D coordinates of labeled landmarks (e.g., nose, paw, tail base),
- confidence scores for each point,
- time series of positions across frames.
From these coordinates, users can derive secondary features such as stride length, stance duration, joint angles, or velocity but these are not standardized outputs of the system.
Translational relevance (and limitation)
DLC excels at point tracking, not interpretation. Its flexibility is also its limitation:
- A “paw” in a mouse dataset is not formally equivalent to a “foot” in a human dataset.
- Landmark definitions vary widely between different laboratories and species.
- There is no built-in normalization for limb length, body size, or dynamic similarity.
As a result, DLC datasets are precise but semantically underdefined. Translation from rodents to humans requires substantial downstream biomechanical mapping and normalization, which is rarely standardized across studies.
OpenCap / OpenSim
What do they do?
OpenSim and its recent extension OpenCap are human-focused biomechanical modeling platforms that infer musculoskeletal dynamics from motion data.[21,22] These systems use physics-based models to estimate joint angles, moments, muscle activations, and energetic cost.
What do they output?
These tools produce:
- joint kinematics and kinetics,
- ground-reaction forces,
- muscle force and power estimates,
- energetics and work profiles.
These outputs represent not just motion but high-level biomechanical meaning.
Translational relevance (and limitation)
OpenSim/OpenCap provide gold-standard human gait descriptors. However:
- They are built on human musculoskeletal assumptions (upright posture, specific joint models).So, they are not readily applicable to rodents or other quadrupeds.
- Scaling human models down to animals introduces large anatomical and functional errors.
Thus, these systems are ideal reference frameworks for humans, but they cannot directly analyze animal gait. Their value for translation lies in serving as target benchmarks against which animal-derived metrics can be compared.
Arena-based tracking systems (ANY-maze, EthoVision, etc.)
What do they do?
These systems track an animal’s position and movement in a 2-D arena and are widely used in behavioral neuroscience.[23]
What do they output?
Typical outputs include:
- distance traveled,
- speed,
- time spent in zones,
- movement bouts or activity levels.
Translational relevance (and limitation)
These tools capture gross locomotor activity, not gait mechanics. They do not resolve:
- stride cycles,
- limb coordination,
- symmetry,
- or variability.
They do provide useful contextual or baseline locomotor measures, but they fail to support detailed gait comparison within or across species.
ConductVision (CV):An example of an explicitly translational approach
ConductVision is an integrated, markerless 3-D tracking and analysis platform under development, designed from the outset for cross-species gait and behavior comparison. It is an example of the implementation of this translational framework, a system designed to sit between raw motion tracking and clinical gait interpretation.
What does it output?
Rather than exporting only coordinates, ConductVision produces:
- segmented gait cycles,
- cadence and stride timing,
- posture angles,
- hesitation and pause metrics,
- smoothness and variability indices,
- symmetry measures aligned with clinical gait analysis.
Outputs are structured, metadata-rich, and designed to parallel human clinical gait variables.
Translational relevance
The defining feature of ConductVision is not tracking accuracy alone, but intentional metric alignment. Rodent behavioral motifs are explicitly mapped onto human gait axes such as:
- speed (dimensionless),
- symmetry,
- stability (CV),
- coordination,
- and efficiency.
By exporting normalized, FAIR-compliant metrics, ConductVision aims to make rodent and human gait data directly comparable, rather than merely juxtaposed.
Where This Is All Heading
The field is slowly shifting from raw measurements (stride length, distance traveled, time moving) to interpretable, universal metrics. And that shift is crucial.
With dimensionless scaling and standardized outputs, we can finally ask big translational questions:
- Does a rodent model truly mimic human gait pathology?
- Do treatments improve gait in ways that would matter clinically?
- Can we benchmark recovery across species using the same metrics?
For the first time, the answer is starting to look like “yes.”
Raw gait data won’t ever match between rodents and humans but normalized, dimensionless metrics can.
By focusing on universal numbers like the Froude value, CV, symmetry indices, and energy cost, and by developing cross-species platforms like ConductVision, we’re building a shared language of movement that works from mice to humans.
And that brings us closer to what translational neuroscience has always wanted:
A reliable bridge between preclinical behavior and human biomechanics.
REFERENCES
- Amende I, Kale A, McCue S, Glazier S, Morgan JP, Hampton TG. Gait dynamics in mouse models of Parkinson’s disease and Huntington’s disease. J Neuroeng Rehabil. 2005 Jul 25;2:20. doi: 10.1186/1743-0003-2-20. PMID: 16042805; PMCID: PMC1201165.
- Bonanno, M., De Nunzio, A. M., Quartarone, A., Militi, A., Petralito, F., & Calabrò, R. S. (2023). Gait Analysis in Neurorehabilitation: From Research to Clinical Practice. Bioengineering, 10(7), 785. https://doi.org/10.3390/bioengineering10070785
- Hu X, Charles JP, Akay T, Hutchinson JR, Blemker SS. Are mice good models for human neuromuscular disease? Comparing muscle excursions in walking between mice and humans. Skelet Muscle. 2017 Nov 16;7(1):26. doi: 10.1186/s13395-017-0143-9. PMID: 29145886; PMCID: PMC5689180.
- Timotius, I., Moceri, S., Plank, A.-C., Habermeyer, J., Canneva, F., Casadei, N.,… von Hörsten, S. (2018). Rodent’s Stride Length Depends on Body Size: Implications for CatWalk Assay. In Robyn Grant, Tom Allen, Andrew Spink, Matthew Sullivan (Eds.), Measuring Behavior 2018. Manchester, GB: UK.
- Alexander, R.M. (1991). Dynamic Similarity in the Analysis of Animal Movement. In: Schmidt-Kittler, N., Vogel, K. (eds) Constructional Morphology and Evolution. Springer, Berlin, Heidelberg. https://doi.org/10.1007/978-3-642-76156-0_6
- Suckow MA. The Laboratory Mouse. 2nd ed. CRC Press; 2012.
- Heglund, N. C., & Taylor, C. R. (1988). Speed, stride frequency and energy cost per stride: The relationships of energetics and biomechanics. Journal of Experimental Biology, 138, 301–318.
- Lei J, Linghu C, Pan M, Hsia KJ. Hard-to-soft part ratios in natural crawlers inform hybrid robotic design. Extreme Mechanics Letters. 2025 Sep 1;102394. doi:10.1016/j.eml.2025.102394.
- Granatosky, Michael C, and Eric J McElroy. “Stride frequency or length? A phylogenetic approach to understand how animals regulate locomotor speed.” The Journal of experimental biology vol. 225,Suppl_1 (2022): jeb243231. doi:10.1242/jeb.243231
- Alexander, R. McN., & Jayes, A. S. (1983). A dynamic similarity hypothesis for the gaits of quadrupedal mammals. Journal of Zoology, 201(1), 135–152.
- Kleiber M. Body size and metabolism. Hilgardia. 1932;6(11):315–353.
- Kramer PA, Sarton-Miller I. The energetics of walking: is Froude number (Fr) useful for metabolic comparisons? Gait & Posture. 2008;27(2):209–215.
doi:10.1016/j.gaitpost.2007.02.009 - Kramer PA, Sylvester AD. Humans, geometric similarity, and the Froude number. PLoS ONE. 2013;8(9):e74418.
doi:10.1371/journal.pone.0074418 - Hausdorff, J. M., Zemany, L., Peng, C. K., & Goldberger, A. L. (1997). Maturation of gait dynamics: Stride-to-stride variability and its temporal organization in children. Journal of Applied Physiology, 86(3), 1040–1047.
- Machado, A. S., et al. (2015). A quantitative framework for whole-body coordination reveals specific deficits in freely walking ataxic mice. eLife, 4, e07892.
- Baird, A. L., Meldrum, A., & Dunnett, S. B. (2006). The staircase test of skilled reaching in mice. Brain Research Bulletin, 70(6), 508–517.
- Robinson RO, Herzog W, Nigg BM. Use of force platform variables to quantify the effects of chiropractic manipulation on gait symmetry. Journal of Manipulative and Physiological Therapeutics. 1987;10(4):172–176.
- Taylor, C. R., Heglund, N. C., & Maloiy, G. M. (1982). Energetics and mechanics of terrestrial locomotion. I. Metabolic energy consumption as a function of speed and body size in birds and mammals. Journal of Experimental Biology, 97, 1–21.
- Tucker VA. The energetic cost of moving about. American Scientist. 1975;63(4):413–419.
- Mathis, A., et al. (2018). DeepLabCut: Markerless pose estimation of user-defined body parts with deep learning. Nature Neuroscience, 21, 1281–1289.
- Delp, S. L., et al. (2007). OpenSim: Open-source software to create and analyze dynamic simulations of movement. IEEE Transactions on Biomedical Engineering, 54(11), 1940–1950.
- Uhlrich, S. D., et al. (2022). OpenCap: 3D human movement dynamics from smartphone videos. bioRxiv. https://doi.org/10.1101/2022.06.15.496129
- Noldus, L. P., Spink, A. J., & Tegelenbosch, R. A. (2001). EthoVision: A versatile video tracking system for automation of behavioral experiments. Behavior Research Methods Instruments & Computers, 33(3), 398–414.
Written by researchers, for researchers — powered by Conduct Science.
See more of Our Posts
Behavioral Neuroscience
All Resources
Never miss our posts!
Author:

Kritisha Karki
ConductScience Fellow, is a Nepali medical student exploring gait analysis, brain–machine interfaces, and AI-based behavioral assessment for neurological applications.