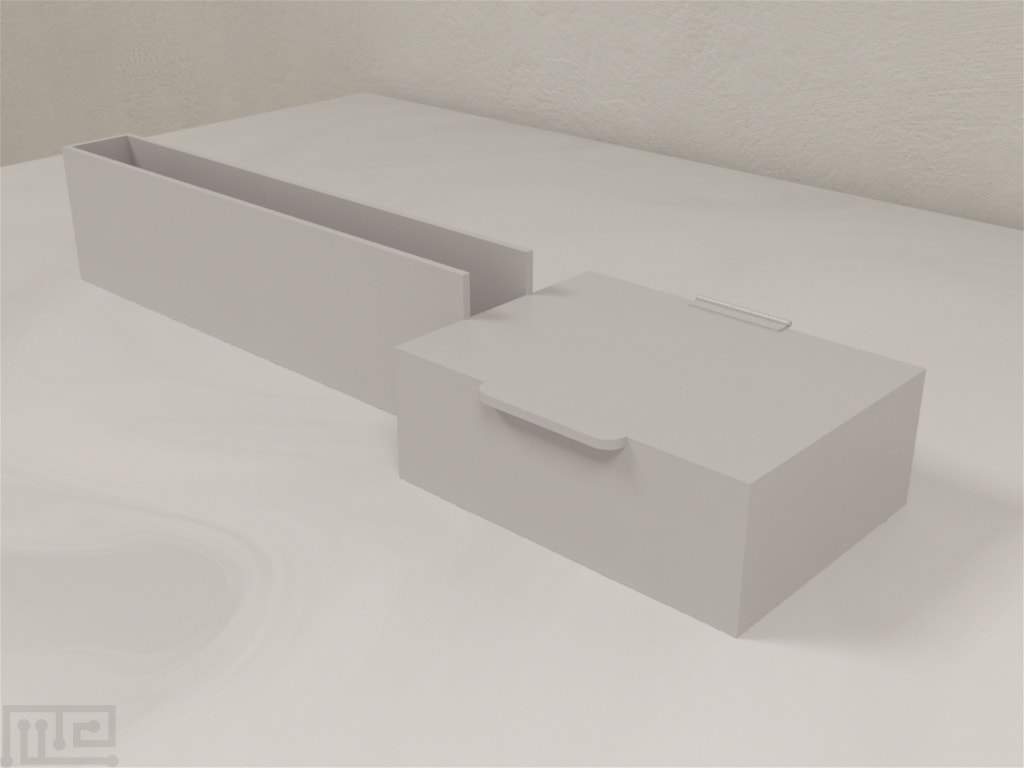
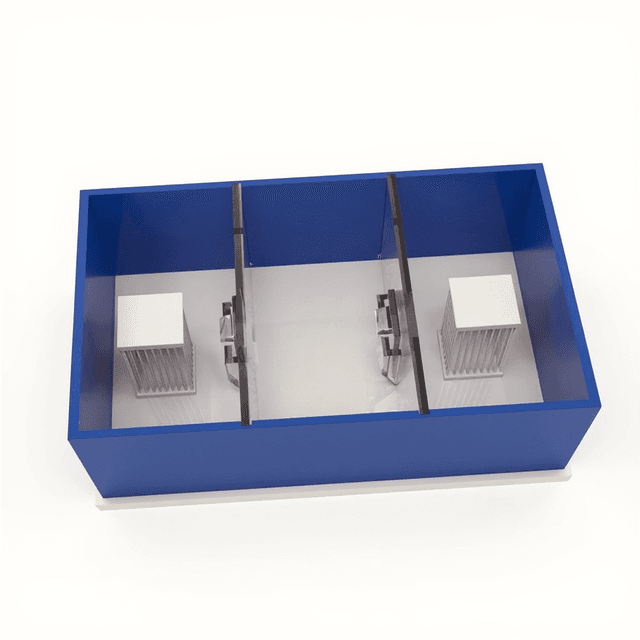
Behavioral Mazes

Gait Test

$1,890.00 - $1,990.00

Manual gait analysis apparatus that captures rodent footprint patterns on paper for quantitative assessment of locomotion parameters including stride length and paw placement.

Color SKU ME-5009-W
$1,990.00
Key Specifications
warranty_length
1 YEAR
storage_included
Yes
assembly_required
Yes
Automation Level
manual
Species
Mouse, Rat
Compatible Tracking Software
ConductVision
SKU:ME-5009-W
Need Help? Visit our Support CenterKnowledge base, order lookup, and ticket support
Scientist guidance
Louise Corscadden, PhD, Director of Science

Louise Corscadden, PhD

Director of Science · ConductScience

Ask Louise about Gait Test fit, setup, configuration, or quote prep.

Accessories

Enhance your setup with compatible accessories

Total: $0.00

Use this apparatus with

The complete Gait Analysis Test workflow

Track behavior

No exact ConductVision gait-analysis page is currently published. Stride length and stance-swing timing are normally captured by a dedicated illuminated runway or paw-print system rather than overhead tracking; keep automated gait kinematics as a roadmap gap.

Supporting page not yet built

Run protocol

Runway setup, walking-speed normalization, paw-print labeling, and definitions for stride length, base of support, stance and swing duration, and regularity index.

ConductMaze Gait Analysis Protocol ->

Analyze output

Confirm runway lighting, camera angle, frame rate, and print-contrast conventions before extracting stride length, stance and swing duration, and regularity index from gait video.

Rodent Gait Video Checklist ->

Configuration considerations

Common Gait Analysis Test setup decisions

Use these notes to scope species, cohort, tracking, and automation needs. Only verified product or support routes are linked from this section.

This productIlluminated runway

Gait Analysis Runway

Illuminated glass runway with a high-speed ventral camera and a goal box at the far end

Standard configuration for locomotor kinematics, capturing paw prints and stance-swing timing as the animal walks across an illuminated runway to a goal box.

Quote

Request Quote
BuyableMouse or rat

Species-Scaled Runway

Runway width and length scaled for mouse or rat stride length

Runway width and length change the number of full step cycles captured, so the runway geometry should match the stride length and body size of the species being tested.

Quote

View options ->
SpecialtyInked paw-print

Inked Paw-Print Walkway

Paper-lined walkway with paw inking for manual stride and base-of-support measurement

Best when a low-cost static record is needed, because inked paw prints on paper give stride length and base of support without an illuminated runway, though without stance-swing timing.

Quote

Request automation help

§ 1

Introduction

The Gait Analysis Test measures locomotor kinematics by recording paw placement, stride length, and the timing of stance and swing as a rodent walks across a runway. Hamers and colleagues automated quantitative gait analysis during overground locomotion in the rat, establishing the runway-based approach widely used today. 1

The core readouts are stride length, base of support, stance and swing duration, and inter-paw coordination summarized as a regularity index. Because these parameters describe how the limbs move and are placed during voluntary walking, gait analysis is sensitive to motor deficits that a single latency or coordination score cannot localize. 1

Walking speed, body size, motivation, runway surface texture, and print contrast all change gait parameters independent of true motor function. A defensible protocol normalizes parameters to walking speed, reports body size, fixes the runway surface and lighting, and uses only steady-state walking segments rather than acceleration or stopping. 1

§ 2

Methods

2.1 Procedure

Steady-state runway walking with paw-print extraction, speed-normalized stride and timing parameters, and regularity-index scoring.

Pre-test setup

  1. 1.Acclimation and habituationHabituate animals to the room and to walking the runway toward a goal box so the first measured run reflects steady locomotion rather than novelty or handling stress.
  2. 2.Apparatus calibrationVerify runway width and length, set the illumination and camera frame rate to resolve individual paw contacts, and confirm print contrast against the runway surface.
  3. 3.Define steady-state criteriaPre-define the minimum number of consecutive steps and the walking-speed window that count as a valid steady-state run, excluding acceleration and stopping segments.
  4. 4.Set parameter definitionsAdopt definitions for stride length, base of support, stance and swing duration, and the regularity index, and decide how each is normalized to walking speed.

Trial sequence

  1. 1.Run across the runwayAllow the animal to walk the runway toward the goal box at a self-selected steady speed and record the ventral or side view of paw contacts.
  2. 2.Extract paw printsLabel each paw contact and its timing from the recording to reconstruct the step cycle for all four limbs.1
  3. 3.Measure stride and timingCompute stride length, base of support, stance duration, and swing duration from the labeled step cycles within the steady-state segment.3
  4. 4.Compute regularity indexCalculate the regularity index from the sequence of paw placements to quantify inter-paw coordination across the run.
  5. 5.Normalize and repeatNormalize parameters to walking speed, run the planned valid runs, and clean the runway between subjects to remove odor and urine cues.4

Critical methodological constraints

  • Walking speed. Stride length, stance, and swing all vary with walking speed. Parameters must be normalized to speed or compared only within a matched speed window across groups.4
  • Steady-state segments. Acceleration and stopping segments distort step timing. Use only consecutive steps within the defined steady-state speed window.4
  • Print/contrast clarity. Poor lighting or low print contrast causes missed or merged paw contacts. Fix illumination, frame rate, and runway surface so contacts are cleanly resolved.1
  • Body size. Larger animals have longer strides and wider bases of support independent of motor function, so body size must be reported and considered.

2.2 Measurement & Analysis

Core gait-analysis endpoints for locomotor kinematics, balance, and quality control.

Stride Length

Locomotor kinematics

Distance between consecutive placements of the same paw, the primary kinematic readout that must be interpreted relative to walking speed.1

Base Of Support

Balance width

Lateral distance between the left and right paws of the fore or hind limbs, indexing the width of the support base during walking.2

Stance Duration

Weight support

Time a paw is in contact with the runway during a step cycle, reflecting the weight-bearing phase.3

Swing Duration

Limb advancement

Time a paw is off the runway and advancing during a step cycle, the limb-advancement phase complementary to stance.

Regularity Index

Inter-paw coordination

A measure of how regularly the four paws are placed in a coordinated sequence, indexing inter-paw coordination across the run.

+ Additional metrics: cadence, duty cycle, paw print area, stride width, walking speed, body size, and per-run video notes.

2.3 stance fraction / duty (analysis)

A compact fraction of the step cycle spent in stance, the duty factor of the limb.

Inline calculator

Type the values your tracker recorded.

Full calculator with 95% CI ->
Stance fraction (duty)

60.0%

Formula: stance duration / (stance duration + swing duration) x 100. Interpret with walking speed, body size, and runway surface because the duty factor shifts with speed and must be compared within a matched speed window. 1

2.4 sample-size planning

Estimate the N per group needed to detect a literature-anchored motor effect at the endpoint you plan to report. Override the defaults with your own pilot numbers.

sample-size planning

Estimate the N per group needed to detect a literature-anchored motor effect at the endpoint you plan to report. Override the defaults with your own pilot numbers.

Spinal-cord-injury vs control rat on an automated runway; representative magnitudes from Hamers et al. (2001) CatWalk gait study.1

Cohen's d

1.40

N per group at 80% power

9

Total N

18

With attrition cushion

20

At 70% / 90% power

7 / 11

Methods sentence

Need ANOVA, proportions, paired design, or a power curve? Open in the full Sample-Size Calculator →

Formula: n = 2 · ((zα/2 + zβ) / d)2, where d = |μ₁ − μ₂| / σ. Assumes equal allocation, normality, and homoskedasticity. The attrition cushion inflates total N by 1 / (1 − dropout); confirm with your IACUC.

§ 3

Results

Aggregate publication data, sample apparatus output, and recent findings from the live PubMed feed.

3.1 Publication trends

PubMed volume and co-occurring behavioral methods for rodent gait-analysis studies.

Figure 1 · EPM publications by year (PubMed)

The paradigm has been dominant for 40 years and is still growing.

Live · Weekly

2000201020202025 YTD: 131 papers

Total in PubMed since 1985: 3,120+ papers. Updated 2026-06-12.

Figure 2 · Methods co-occurring with EPM (last 12 months)

Other paradigms most often run alongside EPM in the same paper.

Live

3.2 Sample apparatus output

Representative output from a steady-state runway walk normalized to a matched walking-speed window.

Table 1 · Per-animal EPM scoring output

Download sample CSV →
AnimalGroupStride lengthBase of supportRegularity indexStance fraction
GA-001Control6.3 cm2.5 cm97%59.5%
GA-002Control6.1 cm2.6 cm96%60.2%
GA-003Control6.0 cm2.7 cm95%58.8%
GA-004Impaired4.9 cm3.3 cm83%67.0%
GA-005Impaired4.6 cm3.5 cm80%69.0%
GA-006Impaired4.8 cm3.4 cm82%68.2%

Synthetic example for illustration only. Normalize stride and timing parameters to walking speed and report body size before interpreting kinematic differences.

3.3 Recent findings (live PubMed feed)

  • Jun 2026Source note

    Gait-analysis methods continue to emphasize walking-speed normalization and steady-state segment selection.

    Static methods note aligned with Hamers et al. (2001), Batka et al. (2014), and Vandeputte et al. (2010).

    Review gait studies for parameters normalized to walking speed, only steady-state segments analyzed, fixed runway surface and lighting, and reported body size before interpreting stride and timing differences.

    Methods overviewReproducibility
  • Jun 2026Source note

    Gait analysis as one assay in a motor battery: pair with horizontal ladder, rotarod, and rodent treadmill.

    Static methods note aligned with Clarke & Still (1999) and Mendes et al. (2015).

    A single stride-length value is a screening signal. Locomotor deficits are most defensible when confirmed with separate spatial and timing endpoints and an independent motor assay scored in the same cohort.

    Motor batteryLocomotor kinematics

View all 3120matching papers on PubMed ->

§ 4

Discussion

Limitations of the paradigm, methodological caveats, and current directions.

4.1 Common confounds

Variables that shift Gait Analysis Test results independent of anxiety state.

Walking speed (must normalize)

Stride length, stance, and swing all vary with walking speed. Normalize parameters to speed or compare only within a matched speed window across groups.

Body size

Larger animals have longer strides and wider bases of support independent of motor function, so body size must be reported and considered.

Motivation

A weak goal-box incentive produces hesitant or stop-start walking, which distorts step timing and prevents valid steady-state runs.

Surface/runway texture

Runway surface and traction change step mechanics. The surface must be held constant across groups for parameters to be comparable.

Print/contrast clarity

Poor lighting or low print contrast causes missed or merged paw contacts. Fix illumination, frame rate, and surface so contacts are cleanly resolved.

Confound checklist

Tick the confounds your protocol addresses, then export a methods-paragraph blurb you can paste into your manuscript.

Preview exported markdown
## Gait Analysis Test — methods controls

Confounds controlled in this protocol:

- **Walking speed (must normalize).** Stride length, stance, and swing all vary with walking speed. Normalize parameters to speed or compare only within a matched speed window across groups.
- **Body size.** Larger animals have longer strides and wider bases of support independent of motor function, so body size must be reported and considered.
- **Motivation.** A weak goal-box incentive produces hesitant or stop-start walking, which distorts step timing and prevents valid steady-state runs.
- **Surface/runway texture.** Runway surface and traction change step mechanics. The surface must be held constant across groups for parameters to be comparable.
- **Print/contrast clarity.** Poor lighting or low print contrast causes missed or merged paw contacts. Fix illumination, frame rate, and surface so contacts are cleanly resolved.

4.2 Construct validity caveats

Gait analysis is strongest when parameters are normalized to walking speed, only steady-state segments are used, and runway surface and lighting are fixed before testing. Stride length, base of support, and stance-swing timing index different aspects of locomotion; report them separately and confirm motor deficits with an independent assay such as the horizontal ladder or rotarod. 1

4.3 Special considerations

Why must I normalize to walking speed?

Stride length, stance, and swing all change with how fast the animal walks. Without speed normalization or a matched speed window, a speed difference between groups can masquerade as a gait deficit.

When should I use the horizontal ladder instead?

Use the horizontal ladder when the question is skilled limb placement on discrete rungs. Gait analysis characterizes the kinematics of continuous overground walking rather than precision placement.

Illuminated runway or inked paw prints?

An illuminated runway captures stance and swing timing as well as stride and base of support, while inked paw prints give only the static spatial parameters. Choose based on whether step timing is needed.

4.4 Current directions

Quarterly editorial review of emerging Gait Analysis Test methodology. Q2 2026

Methods

Speed normalization standards

Reporting parameters within a matched walking-speed window improves comparability of stride and timing measures between labs and studies.

Emerging

Automated paw-print labeling

High-frame-rate runways with automated paw detection improve the consistency of stride, stance, and swing extraction and reduce observer burden.

Methods

Separate spatial and timing endpoints

Reporting stride length, base of support, and stance-swing timing separately is increasingly expected because each captures a distinct aspect of locomotion.

Emerging

Multi-assay motor batteries

Gait analysis is paired with horizontal ladder, balance beam, and rotarod to separate locomotor kinematics from skilled placement and coordination.

§ 5

References

5 selected methods and validation references for Gait Analysis Test.

  1. Hamers FP, Lankhorst AJ, van Laar TJ, Veldhuis WB, Gispen WH. Automated quantitative gait analysis during overground locomotion in the rat: the CatWalk method. J Neurotrauma. 2001;18(2):187-201. doi:10.1089/08977150150502613
  2. Clarke KA, Still J. Gait analysis in the mouse. Physiol Behav. 1999;66(5):723-729. doi:10.1016/s0031-9384(98)00343-6
  3. Vandeputte C, Taymans JM, Casteels C, et al. Automated quantitative gait analysis in animal models of movement disorders. BMC Neurosci. 2010;11:92. doi:10.1186/1471-2202-11-92
  4. Batka RJ, Brown TJ, Mcmillan KP, Meadows RM, Jones KJ, Haulcomb MM. The need for speed in rodent locomotion analyses. Anat Rec (Hoboken). 2014;297(10):1839-1864. doi:10.1002/ar.22955
  5. Mendes CS, Bartos I, Marka Z, Akay T, Marka S, Mann RS. Quantification of gait parameters in freely walking rodents. BMC Biol. 2015;13:50. doi:10.1186/s12915-015-0154-0
Gait Test
Gait Test
$1,890.00 - $1,990.00
Added to quoteView Quote