ConductVision Enterprise

Retail

ConductVision counts shoppers, carts and stops at displays from the cameras a store already runs, for store operations and merchandising teams.

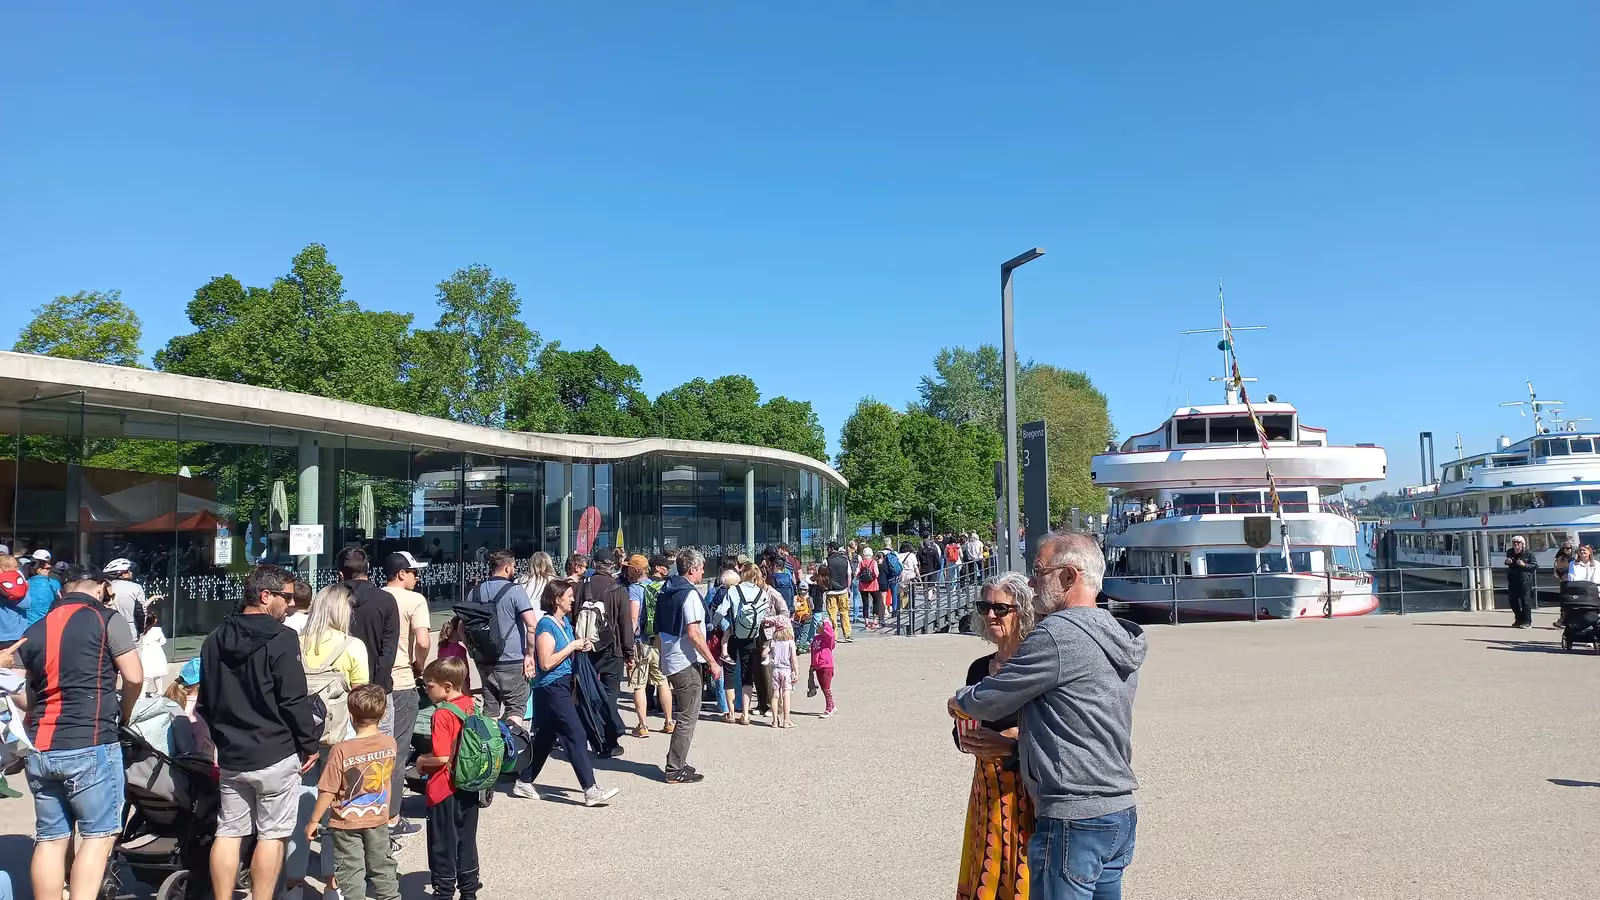
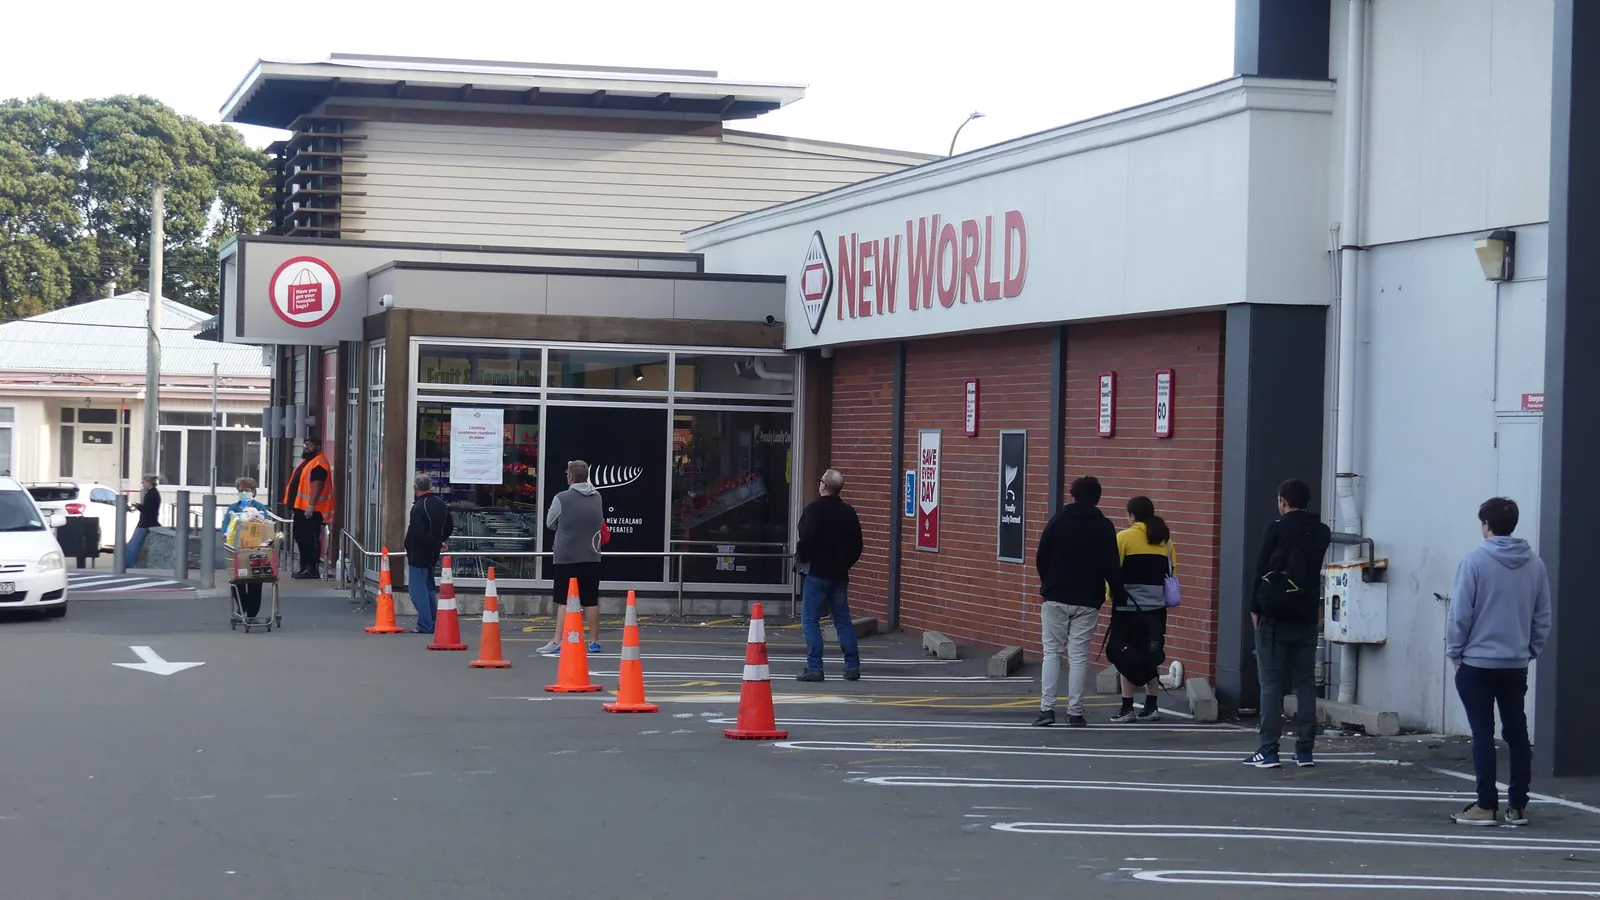
Shoppers wait in a spaced line outside a supermarket entrance; boxes mark 10 people, a bag and a shopping cart.12 detections
Supermarket entrance queue
  • Person10
  • Bag1
  • Cart1

ConductVision detections on this photo. Photo: Alan Tennyson, CC BY-SA 4.0, cropped.

Retailers invest heavily in camera infrastructure primarily for loss prevention, yet those same feeds contain rich behavioral data that most organizations never extract. Customer flow patterns, dwell times, queue lengths, and shelf interaction rates remain invisible without dedicated analytics. ConductVision's technology can transform security camera networks into business intelligence platforms, providing store operations teams with the same depth of behavioral data that e-commerce teams take for granted. The result can be evidence-based merchandising, staffing optimization, and a measurable reduction in shrinkage.

Outcomes

What your team gets

Who shops with a cart

A store counts the people who come in and has no count of who takes a cart.

Staffing and checkout plans treat a quick visit and a full weekly shop the same way.

How
In a pilot, ConductVision counts shoppers with and without a cart as they cross the entrance line.
You get
Cart share by hour and entrance, to plan staffed checkouts and self-checkout.

Carts where shoppers need them

Carts pile up in parking lot corrals while the bay at the entrance runs empty.

Shoppers arrive to find no carts, and staff fetch them at the busiest hour.

How
ConductVision counts the carts in the entrance bay and in each parking lot corral.
You get
An alert when the entrance bay runs low, and a count of carts left in each corral.

Shoppers who stop at a display

A seasonal display or pop-up stand gets judged on its sales alone.

Low sales can mean few people passed or many passed without stopping, and each needs a different fix.

How
ConductVision counts the shoppers passing a display and the ones who stop beside it.
You get
Passes, stops and stop rate for each display by hour.

The challenge

Brick-and-mortar retailers operate with far less behavioral data than their e-commerce counterparts. In-store conversion paths, dwell-to-purchase correlations, and real-time queue pressure remain opaque. Loss prevention teams review footage reactively, and staffing models rely on transaction data that lags actual foot traffic by hours.

Our approach

ConductVision can process existing security feeds to generate real-time foot traffic counts, customer journey heatmaps, queue length alerts, and shelf interaction analytics. Loss prevention models can detect concealment behaviors and policy violations, while staffing dashboards can correlate traffic patterns with register throughput.

What the model sees

Detections in two more settings

A long supermarket aisle between shelves and chilled cases; boxes mark two shoppers at the far end.
Chilled aisle in a supermarket
  • Person2

ConductVision detections on this photo. Photo: Wilfredor, CC BY-SA 4.0, cropped.

A grocery aisle with stocked shelves and a shopper's cart; a box marks the cart.
Grocery aisle with a cart
  • Cart1

ConductVision detections on this photo. Photo: Tessa Bury, CC BY 4.0, cropped.

Endpoints

What a pilot measures

Each endpoint is defined before the pilot starts, with what is counted, its unit and how the results are broken down.

What a pilot measures
PrimaryDisplay stop rateShare of shoppers passing a display who stop beside it for longer than the time set for that display.Unit:%By:Display, hour
SecondaryCart shareShare of shoppers entering with a cart, counted at the entrance line.Unit:%By:Entrance, hour
Low cart timeMinutes the entrance cart bay holds fewer carts than the level the store sets.Unit:minutes per dayBy:Entrance, hour
Display passesShoppers who walk through a display's zone, counted once per pass.Unit:shoppers per hourBy:Display

How we check the model

Each pilot measures ConductVision on your own footage against a sample checked by hand, before anyone relies on its numbers.

  • Entrance count agreement

    Difference between the ConductVision entrance count and a reviewer's hand count of sampled footage.

    shoppers per hour (mean absolute difference) · by entrance, crowd level

  • Cart label agreement

    Share of shoppers whose cart or no-cart label matches a reviewer's label on sampled clips.

    % · by entrance

  • Stop timing error

    Difference between the ConductVision stop time at a display and a reviewer's timing from the same clip.

    seconds (median absolute difference) · by display

Use cases

Where teams put it to work

Foot Traffic and Conversion Analytics

Entry/exit cameras can count visitors by hour and zone, correlating traffic with POS transactions to calculate true conversion rates. Traffic pattern shifts after merchandising changes or promotional events can be quantified automatically.

Customer Journey Heatmaps

Overhead cameras can generate dwell-time heatmaps showing which aisles, endcaps, and displays attract the most engagement. Merchandising teams can use this data to optimize product placement and evaluate promotional effectiveness.

Queue Detection and Staffing Alerts

Checkout queue lengths and wait times can be monitored in real time. When thresholds are exceeded, alerts can prompt managers to open additional registers or redirect staff, reducing abandonment from long waits.

Loss Prevention

Behavioral models can identify concealment gestures, bag-stuffing patterns, and ticket-switching activities. Alerts can be routed to LP teams with annotated video clips, enabling intervention before subjects leave the premises.

Shelf Monitoring and Planogram Compliance

Aisle cameras can detect out-of-stock conditions, misplaced products, and planogram deviations. Restocking alerts can be sent to floor staff in real time, reducing lost sales from empty shelves during peak hours.

Foot Traffic Analysis

The challenge

Retailers and venue operators lack accurate, continuous data on how many people visit their locations and how traffic varies by time, day, and season.

How ConductVision helps

ConductVision can count visitors at entrances and track flow through the space, providing hourly, daily, and seasonal traffic curves. This data can inform staffing schedules, promotional timing, and performance benchmarking across locations.

retailsmart cityentertainment

Dwell Time Measurement

The challenge

Understanding how long customers spend in specific areas is valuable for evaluating displays and layouts, but manual observation is impractical at scale.

How ConductVision helps

The platform can measure how long individuals remain in defined zones, aggregating dwell time distributions across departments, displays, and service areas. Longer dwell times near promotional displays correlate with engagement, informing merchandising decisions.

retailentertainmenthealthcare

Heatmap Generation

The challenge

Store managers and designers need to understand spatial usage patterns, but traditional methods like manual counting or surveys are infrequent and imprecise.

How ConductVision helps

ConductVision can generate visual heatmaps showing where customers concentrate, which paths they follow, and which areas they avoid. These heatmaps can update continuously and can be compared across time periods, campaigns, or layout changes.

retailsmart cityentertainment

Demographic Insights

The challenge

Understanding visitor demographics helps tailor marketing and product assortment, but surveys have low response rates and introduce selection bias.

How ConductVision helps

The platform can provide aggregate, anonymized demographic estimates including age range and gender distribution across locations and time periods. No individual identification is performed, and all data can be processed locally to protect privacy.

retailentertainmenthealthcare

Queue Management

The challenge

Long checkout and service queues are the primary driver of customer dissatisfaction in physical retail, yet staffing adjustments often come too late.

How ConductVision helps

ConductVision can monitor queue lengths and wait times at every service point, triggering staffing alerts when thresholds are exceeded. Historical patterns can enable predictive staffing, and real-time data can power customer-facing wait time displays.

retailhealthcarelogistics

Conversion Analytics

The challenge

Brick-and-mortar retailers know their sales figures but often cannot calculate true conversion rates because they lack reliable visitor count data.

How ConductVision helps

The platform can provide accurate visitor counts that, combined with POS transaction data, yield true conversion rates by hour, zone, and entrance. This metric is essential for evaluating promotions, store layouts, and sales team performance.

retailautomotiveentertainment
Systems it connects to

  • Point-of-Sale (POS) Systems
  • Workforce Management Platforms
  • Loss Prevention Software
  • Digital Signage Networks
  • Inventory Management Systems

Pilot

Scope a retail pilot

Tell us about your sites and cameras, and a ConductVision engineer replies with a scoping plan built around the endpoints above.