ConductVision Enterprise

Behavioral Analytics

ConductVision tracks each person in view and reads their pose, so station, venue and campus teams can time waits and count behaviors by zone and hour.

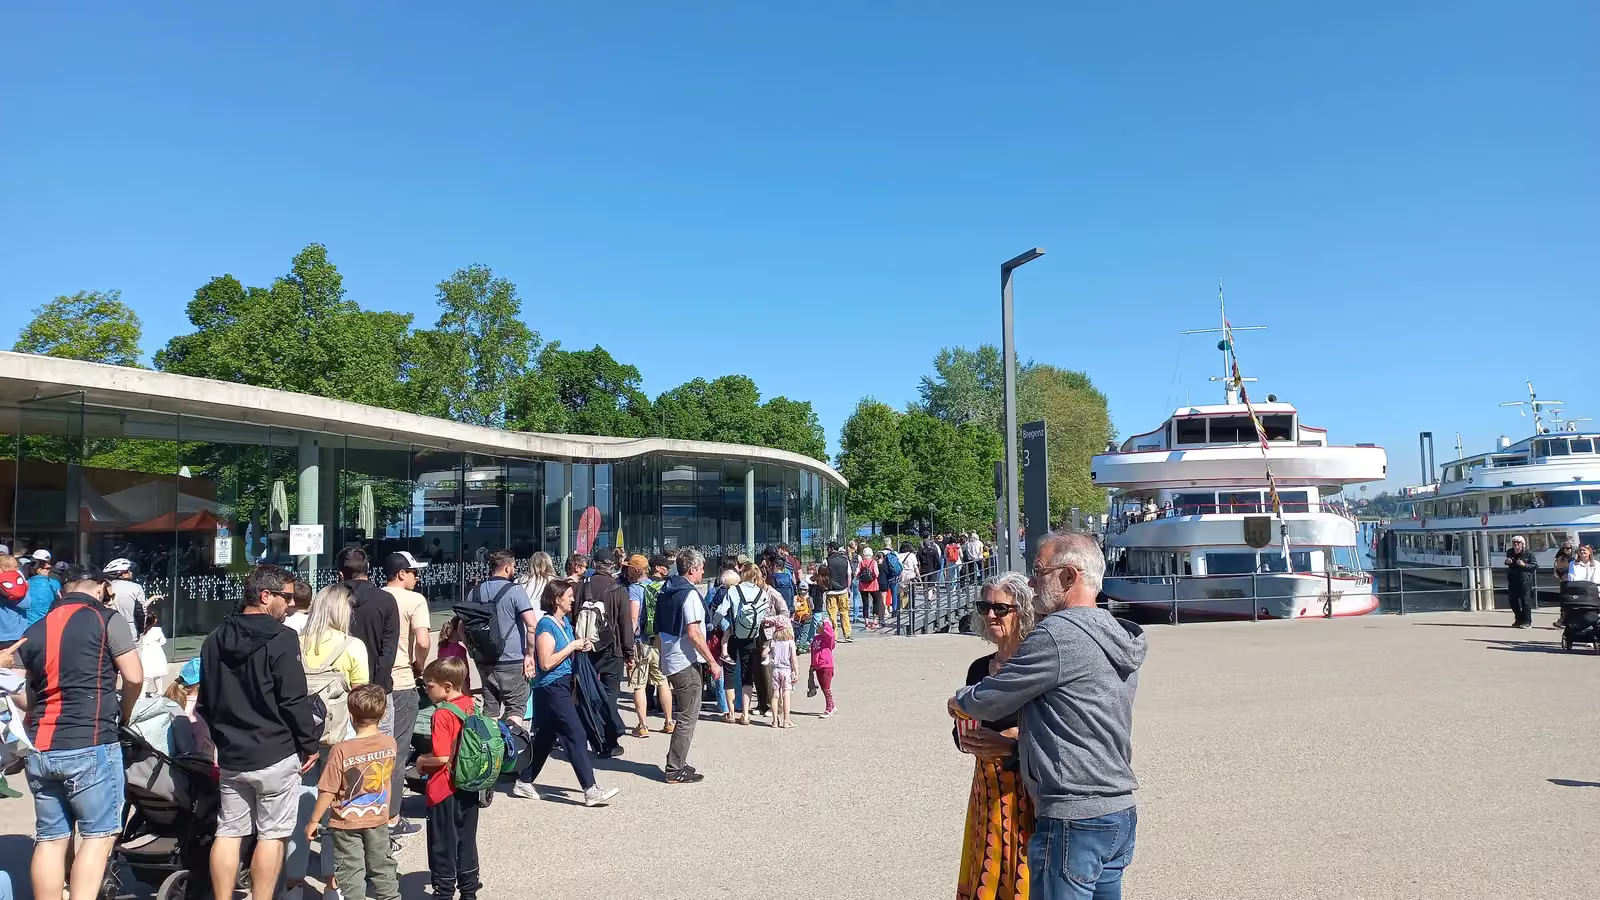
Passengers queue on a lakeside pier in Bregenz, Austria, to board a moored passenger ship; boxes and pose skeletons mark 21 people in the line.21 detections
Ferry pier in Bregenz
  • Person21

ConductVision detections on this photo. Photo: Asurnipal, CC BY-SA 4.0, cropped.

Behavioral Analytics goes beyond simple object detection to analyze how people and crowds behave in a scene. Built on ConductScience's foundations in behavioral science research, the system can classify complex events such as loitering, aggressive physical interactions, crowd surges, abandoned objects, and unusual movement patterns. These are inherently more challenging than object detection, the system addresses the real-world difficulty of interpreting human behavior from video with transparent confidence scoring on every detection. It is designed as a decision-support tool that alerts trained operators to situations requiring human judgment.

Outcomes

What your team gets

Waits timed at every queue

Wait times at counters and gates come from complaints or from a staff member timing a few people.

Extra staff arrive after a queue has built, and the record shows only that people complained.

How
In a pilot, ConductVision tracks each person from joining a queue zone to leaving it and times the stay.
You get
Median and longest waits per queue for each hour, with a clip of each long wait.

How many people stand to wait

On platforms and in waiting areas, people stand when the seats run out.

Seating and shelter plans rest on guesses about how many people stand and for how long.

How
ConductVision reads each person's pose and labels them standing, seated or lying in every sampled frame.
You get
Counts of standing and seated people per area and hour.

Behavior counts on one basis

Monthly safety reviews count incidents from staff reports, and reporting varies with who is on shift.

A trend in the review can reflect staffing changes as much as changes on the ground.

How
ConductVision applies the same rules to every camera and every hour, so each behavior is counted the same way all month.
You get
Monthly counts of each flagged behavior by zone and hour, comparable from month to month.

Shift events with their clips

Night-shift events reach the day team as a line in a logbook.

Without the footage, the next shift cannot tell a one-off from a pattern.

How
Each flagged event keeps a short clip with the tracked person and their pose marked.
You get
A handover list of the shift's events, each with its clip, zone and time.

What the model sees

Detections in two more settings

Attendees wait in a line that winds through a sunlit conference center foyer in London; boxes and pose skeletons mark 17 people.
Conference center foyer in London
  • Person17

ConductVision detections on this photo. Photo: Watty62, CC BY-SA 4.0, cropped.

Shoppers wait with their carts in a spaced line along a walkway outside a supermarket in Italy; boxes and pose skeletons mark 10 people.
Supermarket queue in Italy
  • Person10

ConductVision detections on this photo. Photo: Ian-Art.photography, CC BY-SA 4.0, cropped.

Endpoints

What a pilot measures

Each endpoint is defined before the pilot starts, with what is counted, its unit and how the results are broken down.

What a pilot measures
PrimaryBehavior event rateEvents of each behavior the team switches on, such as a long stay in a keep-clear zone, per 1,000 people tracked.Unit:events per 1,000 peopleBy:Behavior, zone, hour
SecondaryQueue wait timeMinutes from a tracked person's first frame in a queue zone to their last, reported as the median per queue.Unit:minutes (median)By:Queue, hour
Standing shareShare of people in a waiting area whose pose reads as standing, from sampled frames.Unit:%By:Area, hour
Long staysTracked people who stay in a zone past the time limit set for it, counted once per stay.Unit:stays per dayBy:Zone, hour

How we check the model

Each pilot measures ConductVision on your own footage against a sample checked by hand, before anyone relies on its numbers.

  • Behavior alert precision

    Share of behavior alerts a reviewer confirms in a hand-checked sample of alert clips.

    % · by behavior, camera

  • Pose agreement

    Share of sampled people whose standing, seated or lying label matches a reviewer's label.

    % · by camera, pose

  • Wait time error

    Difference between the ConductVision wait time and a reviewer's timing of the same people from the same footage.

    seconds (median absolute difference) · by queue

How it works

Behavioral Analytics in three steps

  1. Connect

    Use Existing Camera Infrastructure

    Behavioral Analytics works with your existing surveillance cameras. The system requires only standard video feeds, no specialized cameras or sensors. Overlapping camera views improve accuracy for complex behaviors.

  2. Analyze

    Classify Behaviors Over Time

    Unlike single-frame detection, behavioral analysis processes sequences of frames to understand actions and interactions. The system tracks individuals across time, analyzing pose, velocity, proximity, and group dynamics to classify events.

  3. Act

    Alert Operators on Anomalies

    When behavior crosses defined thresholds, a person loitering beyond a time limit, a physical altercation, or a sudden crowd movement, the system alerts security operators with video context. All classifications include confidence scores.

What it detects

Classes the models report

  • Person

    Each person in view, tracked with one ID from entering to leaving

  • Body pose

    Keypoints for the head, shoulders, hips, knees and feet of each tracked person

  • Posture

    Standing, seated, bending or lying, read from the pose

  • Time in zone

    First and last frame for each person inside a drawn zone

  • Speed and heading

    Walking pace and direction from each track, for running and counter-flow rules

Features

What the system does

Loitering Detection
Identifies individuals remaining in a defined area beyond a configurable time threshold. Time thresholds and zone boundaries are set per camera view.
Aggression and Fight Detection
Classifies rapid, forceful physical interactions between individuals as potential fights or aggressive encounters. Alerts include video clips for operator verification.
Crowd Surge Detection
Monitors crowd density and movement velocity to detect dangerous surges, stampede-like conditions, or sudden crowd dispersal. Triggers escalating alerts based on severity.
Abandoned Object Detection
Flags stationary objects that appear in a scene and remain unattended beyond a configured time. Reduces false positives by tracking whether an owner is nearby.
Unusual Movement Patterns
Detects movement that deviates from normal patterns, running in a normally walking area, moving against crowd flow, or erratic directional changes.
Trip-Wire and Boundary Crossing
Defines virtual lines and boundaries that trigger alerts when crossed by people or vehicles. Directional filtering enables entry-only or exit-only monitoring.
Tailgating Detection
Identifies unauthorized individuals following authorized personnel through access-controlled doors. Detects when more people pass through a door than credentials presented.
Confidence-Based Filtering
Every behavioral classification includes a confidence score. Operators can set per-behavior thresholds to balance sensitivity against false alarm rates for their specific environment.
Use cases

Where teams put it to work

Transit Station Security

Metro and rail stations need to detect loitering, aggressive behavior, and abandoned bags across dozens of cameras. Behavioral analytics can prioritize feeds requiring immediate attention, reducing operator fatigue.

transportationsmart city

Retail Shrinkage Prevention

Shoplifting often involves predictable behavioral patterns, loitering near high-value merchandise, concealment gestures, and unusual exit behavior. Anomaly detection can flag suspicious activity for loss prevention staff.

retail

Stadium and Arena Crowd Safety

Large venues need to detect crowd surges, bottlenecks, and altercations in real time. Crowd dynamics monitoring can enable safety teams to intervene before dangerous conditions develop.

eventshospitality

Hospital and Healthcare Facility Safety

Emergency departments and behavioral health units experience elevated rates of aggressive incidents. Early detection of escalating interactions can give security staff time to respond and de-escalate.

healthcare

Smart City Public Safety

City surveillance networks monitor public spaces for safety. Behavioral analytics can transform passive monitoring into proactive alerting, detecting incidents that would be missed in banks of video feeds.

smart citygovernment

Campus Security After Hours

Universities and corporate campuses are less populated at night but still require security coverage. Loitering, boundary crossing, and unusual movement detection can supplement reduced overnight guard patrols.

educationcorporate

Parking Structure Safety

Parking garages have complex sightlines and multiple levels. Behavioral detection can identify loitering, aggressive encounters, and vehicles circling suspiciously, alerting security to investigate.

real estatesmart city

Technical overview

Inputs, outputs and hardware

Accuracy and speed are measured on your footage and cameras during the pilot, and reported with the conditions they were measured under.

Models
Person detector, multi-object tracker and pose keypoints (YOLO family)
Input formats
RTSP, ONVIF, MP4, HLS
Output formats
JSON, MQTT, Webhooks, VMS integrations, CSV event logs, video clip exports
Hardware
NVIDIA Jetson Orin (temporal models require more compute), Intel NUC with discrete GPU, on-premise GPU servers

Pilot

Evaluate behavioral analytics on your footage

A pilot takes one prioritized outcome, runs on your cameras, reports the endpoints above and ends with a results review and a decision.