ConductVision Enterprise

Smart City

ConductVision counts people, cars, buses and bicycles at junctions, crossings and bus stops, for city transport and planning teams who decide how streets are used.

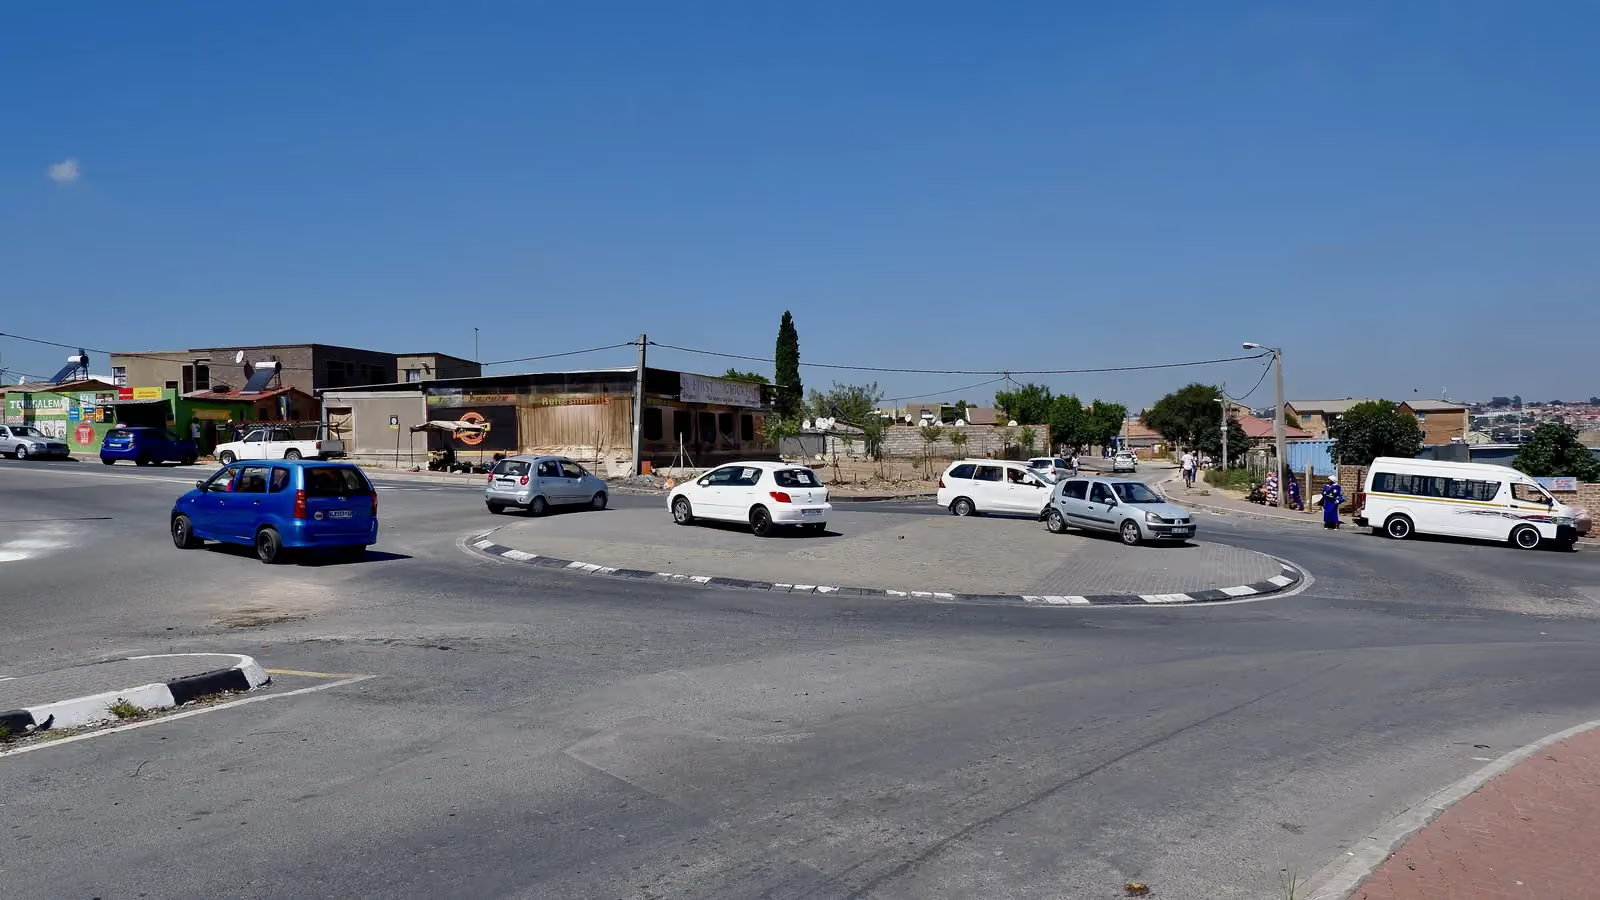
Cars and people on foot move around a busy traffic circle; boxes mark 12 cars, 7 people and 1 truck.20 detections
Traffic circle in Alexandra, Johannesburg
  • Car12
  • Person7
  • Truck1

ConductVision detections on this photo. Photo: Gsalamander, CC BY-SA 4.0, cropped.

Modern cities generate enormous volumes of visual data from thousands of cameras, yet most of that footage goes unanalyzed until after an incident occurs. Municipal agencies struggle with fragmented systems, delayed response times, and limited situational awareness across sprawling urban environments. ConductVision's technology can unify traffic, pedestrian, and environmental feeds into a single analytics layer, turning passive surveillance into proactive city management. The result can be faster incident response, smoother traffic flow, and data-driven urban planning grounded in continuous observation.

Outcomes

What your team gets

Waiting at bus stops

Riders wait at stops without shelter or seats, and the transit agency sees boardings only in fare data.

Shelters and benches go to the stops with the loudest requests.

How
ConductVision counts the people waiting at each stop in every sampled frame.
You get
Peak waiting counts by stop and hour, to rank stops for shelters and seating.
Bus time lost at stops

Buses lose time at busy stops, and the timetable does not show which stops.

Riders get late buses, and schedulers pad every stop the same way.

How
In a pilot, ConductVision times each bus from stopping to pulling away at the stop.
You get
Bus dwell times by stop and hour, beside the waiting count at each arrival.

Bike lane use, counted

A new bike lane opens, and the council asks how many people use it.

Manual counts on a few days cannot show use across seasons and weather.

How
ConductVision counts the bicycles in the lane and on the sidewalk beside it.
You get
Daily bike counts per lane, with the share riding on the sidewalk.

Street use by mode

Street redesigns argue over space for cars, buses, bikes and people on foot.

Without counts by mode, each side brings its own numbers to the meeting.

How
ConductVision applies the same counting rules to every mode on a stretch of street.
You get
Hourly counts by mode for each street, comparable before and after a redesign.

The challenge

Cities face an expanding gap between the volume of visual data their camera networks produce and their capacity to act on it in real time. Traffic congestion, pedestrian safety incidents, and unauthorized encampments persist because operators cannot monitor every feed simultaneously, and legacy systems lack the intelligence to flag anomalies before they escalate.

Our approach

ConductVision can deploy edge-accelerated detection models across existing camera infrastructure, providing real-time alerts for traffic anomalies, pedestrian hazards, crowd density thresholds, and unauthorized activity. Dashboards can aggregate city-wide data into actionable heatmaps and trend reports that integrate directly with traffic management and emergency dispatch platforms.

What the model sees

Detections in two more settings

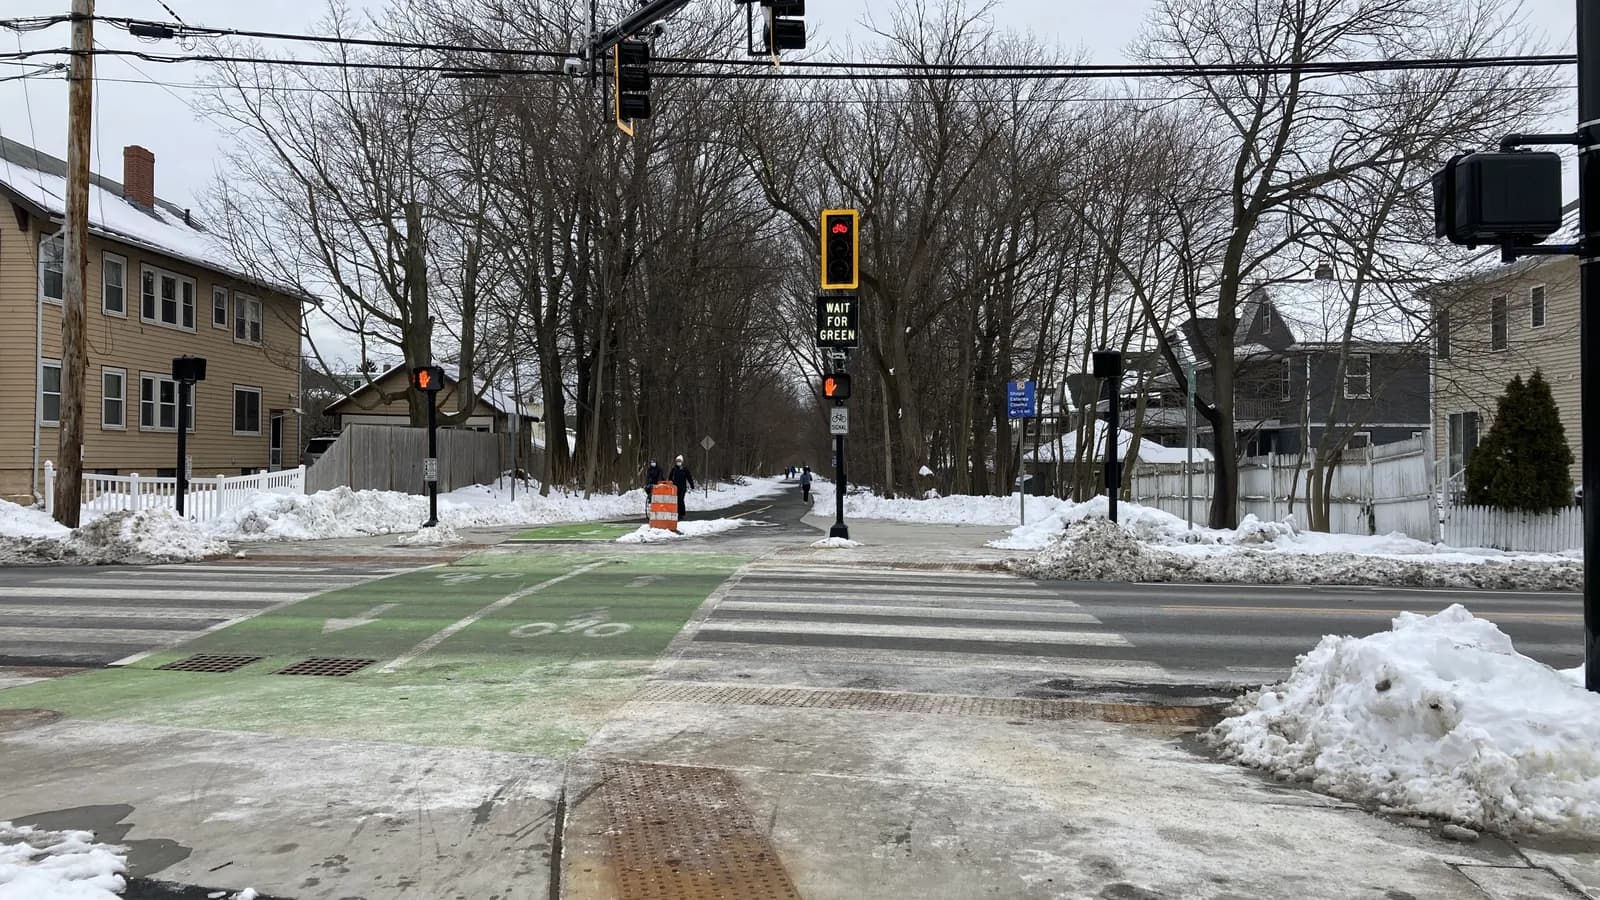
Signals control a bike path crossing on a snowy street; boxes mark 6 traffic lights and 5 people on the path.
Bike path crossing in winter
  • Traffic light6
  • Person5

ConductVision detections on this photo. Photo: Peacearth, CC BY-SA 4.0, cropped.

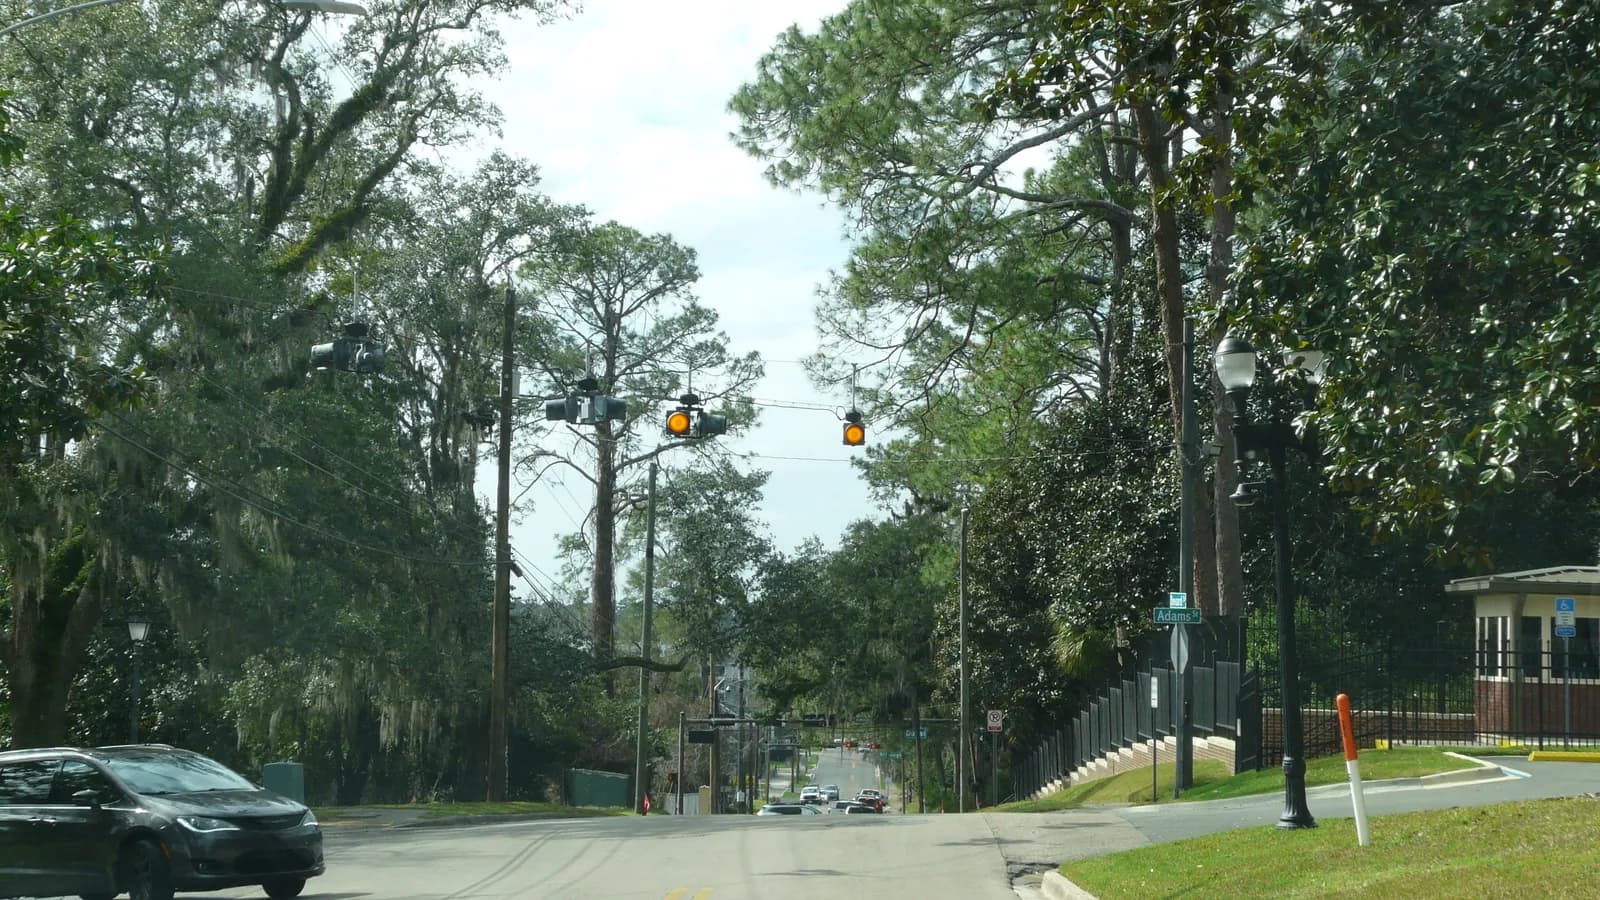
Traffic signals hang over an intersection lined with tall trees; boxes mark 4 traffic lights and 6 cars.
Leafy intersection in Tallahassee
  • Car6
  • Traffic light4

ConductVision detections on this photo. Photo: The Bushranger, CC BY-SA 4.0, cropped.

Endpoints

What a pilot measures

Each endpoint is defined before the pilot starts, with what is counted, its unit and how the results are broken down.

What a pilot measures
PrimaryCounts by modePeople, cars, buses, bicycles and motorcycles crossing a count line on each street, summed per hour.Unit:count per hour, by modeBy:Street, direction, mode
SecondaryPeak stop waitingPeople counted inside each bus stop's waiting area, reported as the hourly peak.Unit:peopleBy:Stop, hour
Bus dwell timeSeconds from a bus coming to rest at a stop to it pulling away.Unit:seconds (median)By:Stop, hour
Sidewalk riding shareBicycles counted on the sidewalk beside a bike lane, as a share of all bicycles on that stretch.Unit:%By:Street, hour

How we check the model

Each pilot measures ConductVision on your own footage against a sample checked by hand, before anyone relies on its numbers.

  • Mode count agreement

    Difference between the ConductVision count and a reviewer's hand count over sampled 15-minute periods, for each mode.

    count per period (mean absolute difference) · by mode, light level

  • Mode agreement

    Share of counted road users whose mode matches the label a reviewer gives.

    % · by mode

  • Dwell time error

    Difference between the ConductVision dwell time and a reviewer's timing of the same bus stops.

    seconds (median absolute difference) · by stop

Use cases

Where teams put it to work

Adaptive Traffic Flow Optimization

Vehicle and pedestrian counts at intersections can feed real-time signal timing adjustments. Historical pattern data enables predictive models that can pre-emptively reroute traffic before congestion materializes during peak hours.

Pedestrian Safety Corridors

Crosswalk cameras can detect jaywalking hotspots, near-miss events, and ADA ramp obstructions. Alert thresholds can notify traffic engineers when a corridor exceeds safety baselines, enabling targeted infrastructure improvements.

Smart Parking Management

Overhead and curb-level cameras can identify occupied and vacant spaces in real time, feeding availability data to municipal apps and dynamic signage. Occupancy analytics can inform pricing adjustments and zoning policy.

Crowd Density Monitoring

Public gathering areas, transit hubs, and event venues can be continuously assessed for crowd density thresholds. When capacity limits approach, automated alerts can reach operations centers and trigger digital signage messaging.

Incident Detection and Alerting

Anomaly models can detect stopped vehicles, wrong-way drivers, abandoned objects, and sudden crowd dispersal patterns. Alerts can be classified by severity and routed to the appropriate dispatch channel.

Urban Planning Data Collection

Long-term foot traffic and vehicle flow datasets can provide planners with empirical evidence for bike lane placement, park utilization, and commercial zone development. Reports can export directly to GIS platforms.

Systems it connects to

  • Traffic Management Systems (SCATS, SCOOT)
  • SCADA Networks
  • Municipal 311/911 Dispatch
  • GIS Platforms (ArcGIS, QGIS)
  • Smart Parking Platforms

Pilot

Scope a smart city pilot

Tell us about your sites and cameras, and a ConductVision engineer replies with a scoping plan built around the endpoints above.