ConductVision Enterprise

Crowd Analytics

Density estimation, flow analysis, and surge detection for any gathering. Available for pilot at venue and city scale.

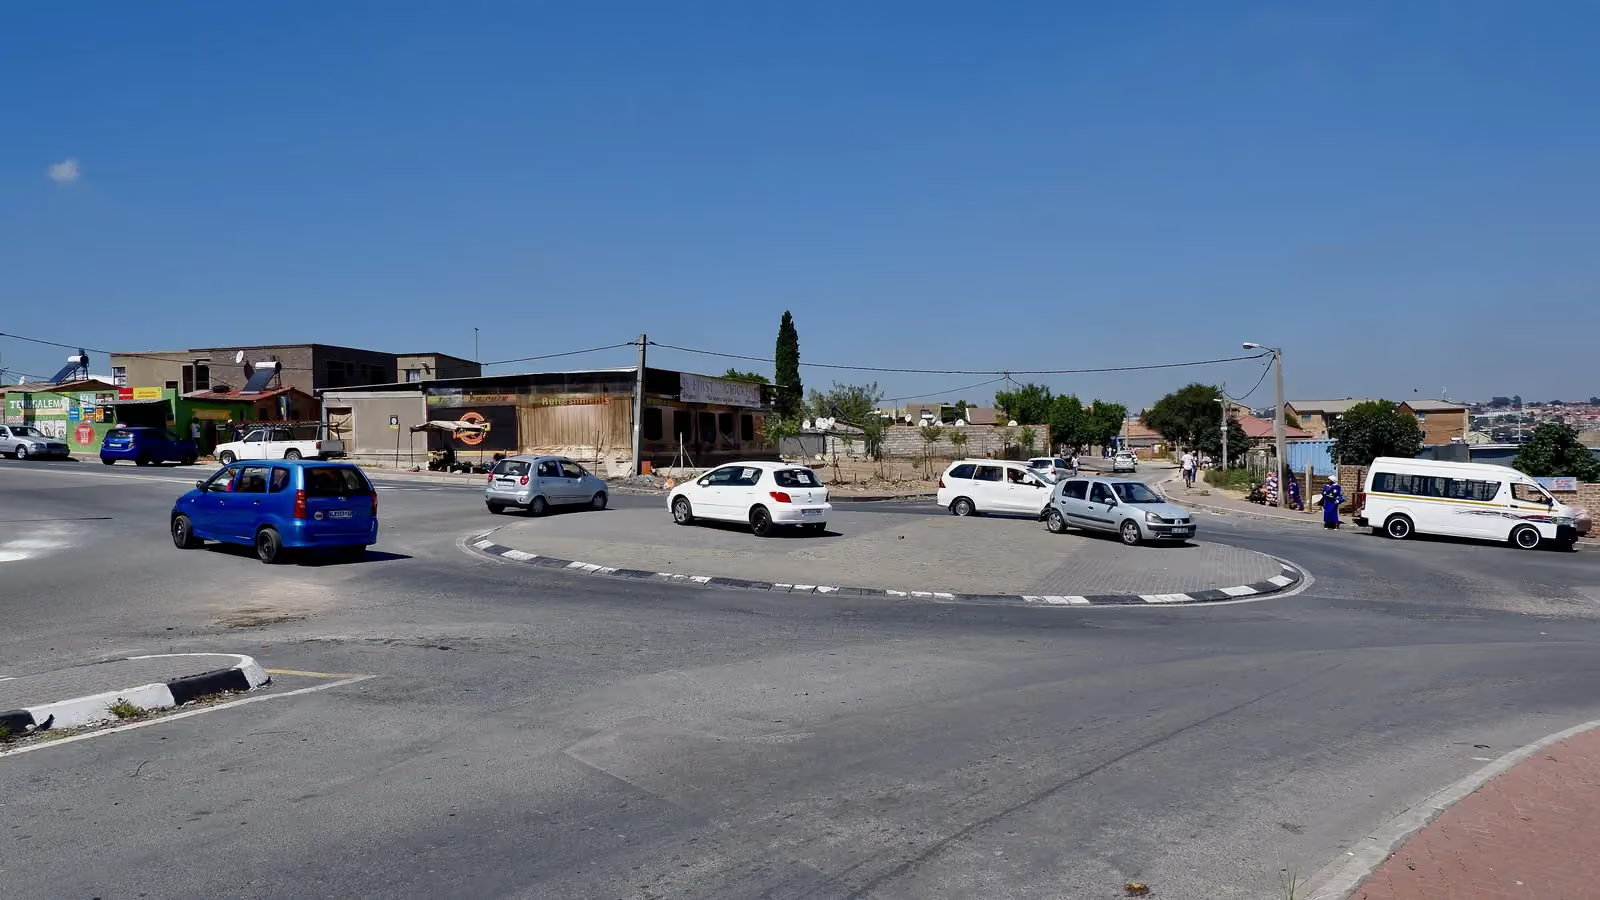
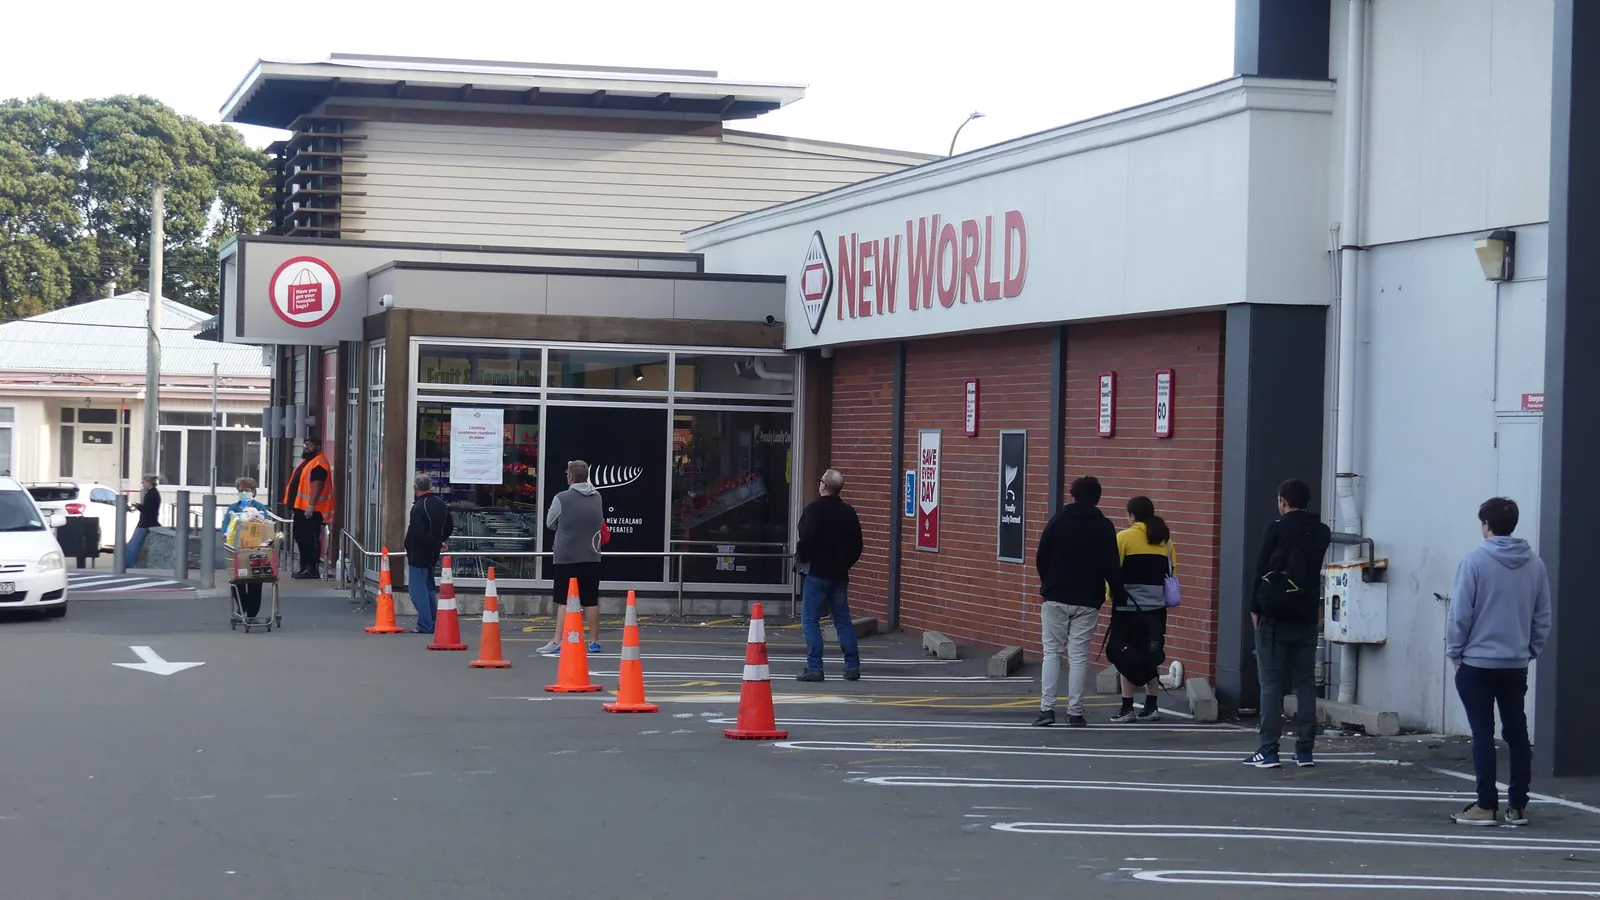
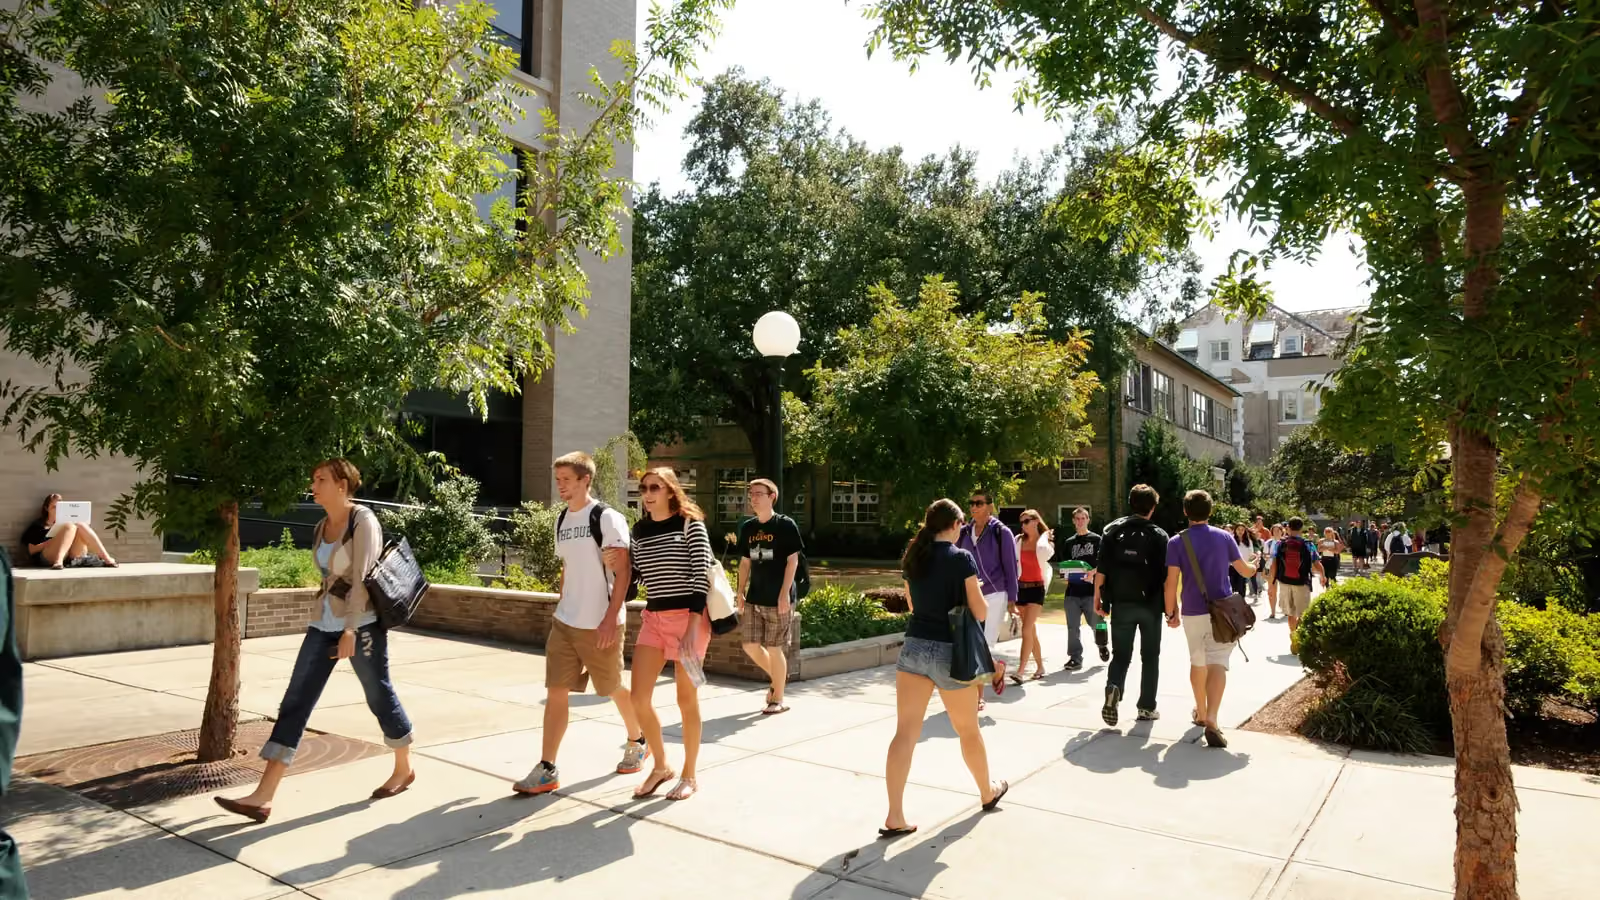
Example crowd analytics scene with an illustrative detection overlay
Illustrative detection overlay, drawn for demonstration. Not model output.

Crowd Analytics goes beyond individual people detection to analyze group-level dynamics: how dense is a crowd, which direction is it flowing, where are bottlenecks forming, and is a dangerous surge developing. The system is designed to process wide-angle and elevated camera feeds covering large areas, stadiums, plazas, transit hubs, and festival grounds, where individual tracking is neither practical nor necessary. Density estimation models count approximate headcounts in regions where people overlap and occlude each other, while flow analysis maps the collective movement direction and speed across the scene.

How it works

Crowd Analytics in three steps

Connect

Connect Elevated Cameras

Mount cameras at elevated vantage points, rooftops, poles, overhead structures, overlooking gathering areas. Wide-angle and fisheye lenses maximize coverage per camera. The platform also accepts drone feeds for temporary event coverage.

Analyze

Estimate Density and Flow

Density regression models estimate the number of people per square meter across the camera view, producing a continuously updated heat map. Optical flow analysis overlays directional vectors showing crowd movement speed and heading, identifying convergence points and counter-flow conditions.

Act

Detect Anomalies and Alert Operators

When density exceeds safe thresholds, flow reversals indicate a stampede risk, or crowd pressure builds at choke points, the system fires graduated alerts to event management and public safety teams. Real-time dashboards show density overlays on facility maps.

Features

Density Estimation

Regression-based models estimate headcount per zone without requiring individual detection. Effective in dense crowds where people heavily overlap and occlude each other.

Flow Direction and Speed Mapping

Optical flow analysis generates directional vectors across the scene, revealing dominant movement patterns, counter-flow conditions, and stagnation zones updated every second.

Surge and Crush Risk Detection

Monitors for the conditions that precede crowd crush events: rapidly increasing density, counter-flow collisions, and crowd pressure at barriers or choke points. Graduated alerts escalate as risk levels increase.

Evacuation Monitoring

Tracks the progress of crowd evacuation from a venue or area, measuring outflow rates at each exit and identifying zones where people remain. Provides real-time evacuation status to incident commanders.

Zone Capacity Management

Define zones across a venue and set capacity thresholds for each. Real-time density feeds enable gate control decisions, closing entry to full zones and redirecting flow to available areas.

Historical Pattern Analysis

Records density and flow data over time to identify recurring patterns: peak arrival times, post-event exit surges, and congestion hotspots. Informs future event planning and infrastructure design.

Drone-Based Temporary Coverage

For temporary events without fixed camera infrastructure, drone feeds provide aerial crowd analytics with the same density and flow capabilities as fixed installations.

Use cases

Stadium and Arena Event Management

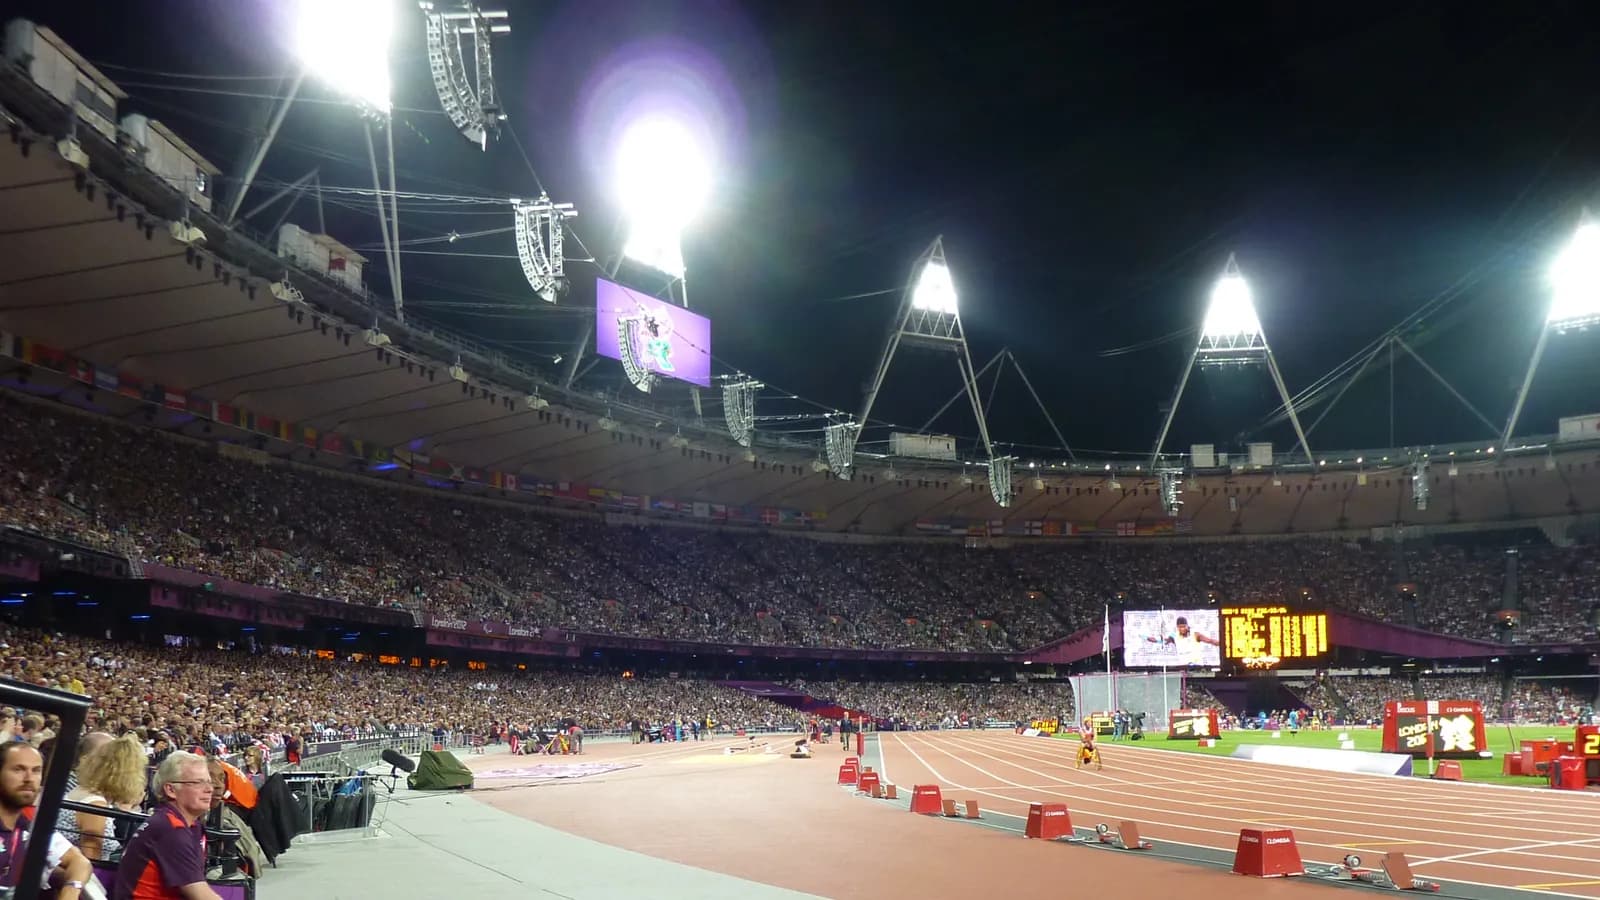
Large venues need to monitor crowd density across concourses, gates, and seating sections during events. Real-time density maps can guide staff deployment, gate opening decisions, and identify sections approaching unsafe density.

eventshospitality

Transit Hub Congestion Management

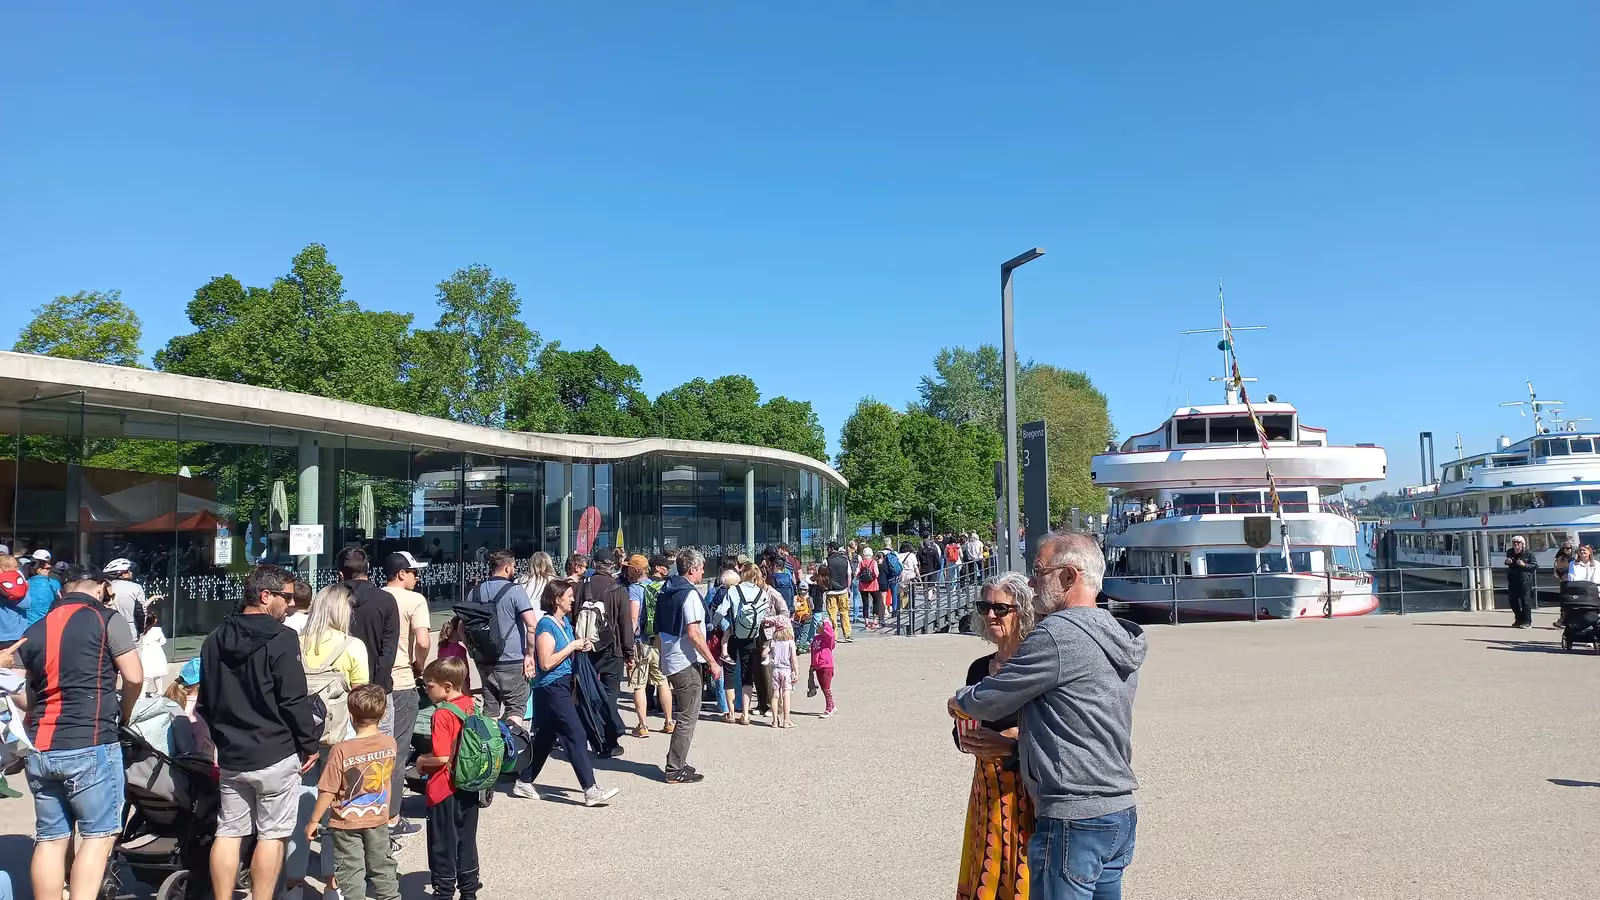
Train stations and bus terminals experience surge conditions during rush hours and service disruptions. Density and flow analytics can trigger dynamic signage, gate control, and platform access management to distribute crowd load.

transportationsmart city

Festival and Open-Air Event Safety

Music festivals and public gatherings on open ground lack built-in crowd management infrastructure. Drone and tower camera analytics can provide the same crowd intelligence that fixed-venue systems offer, enabling safety teams to spot dangerous density buildups.

eventsgovernment

Retail and Shopping Center Traffic

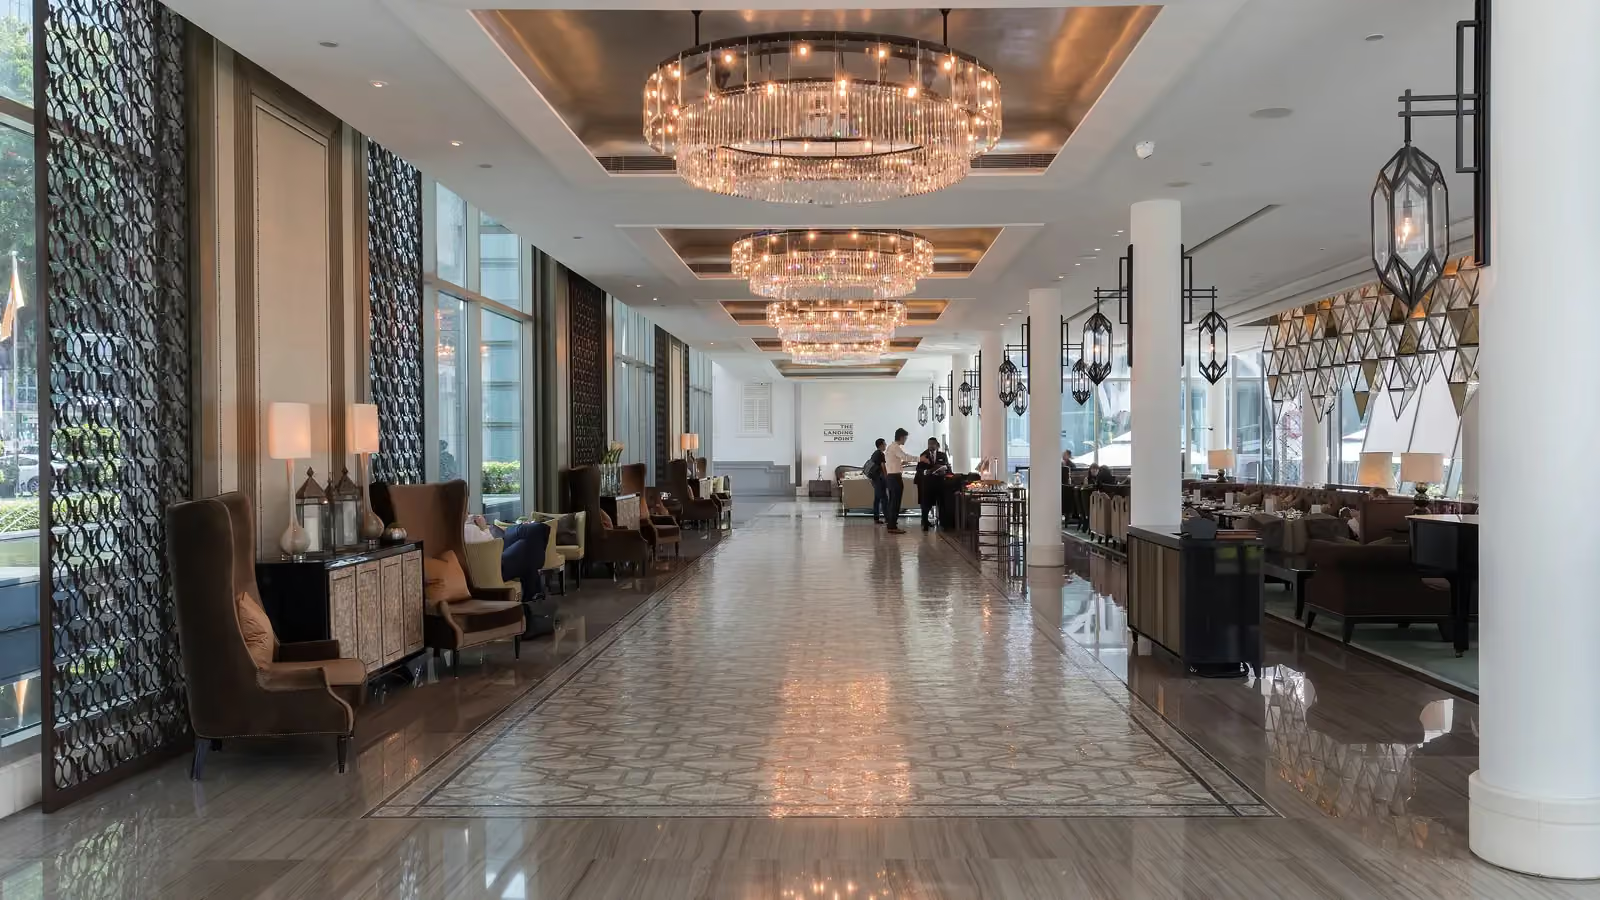
Shopping centers need to understand pedestrian flow through corridors, atriums, and food courts. Crowd analytics can reveal high-traffic corridors, underutilized areas, and peak congestion times to inform tenant placement and wayfinding design.

retailreal estate

Public Safety and Protest Monitoring

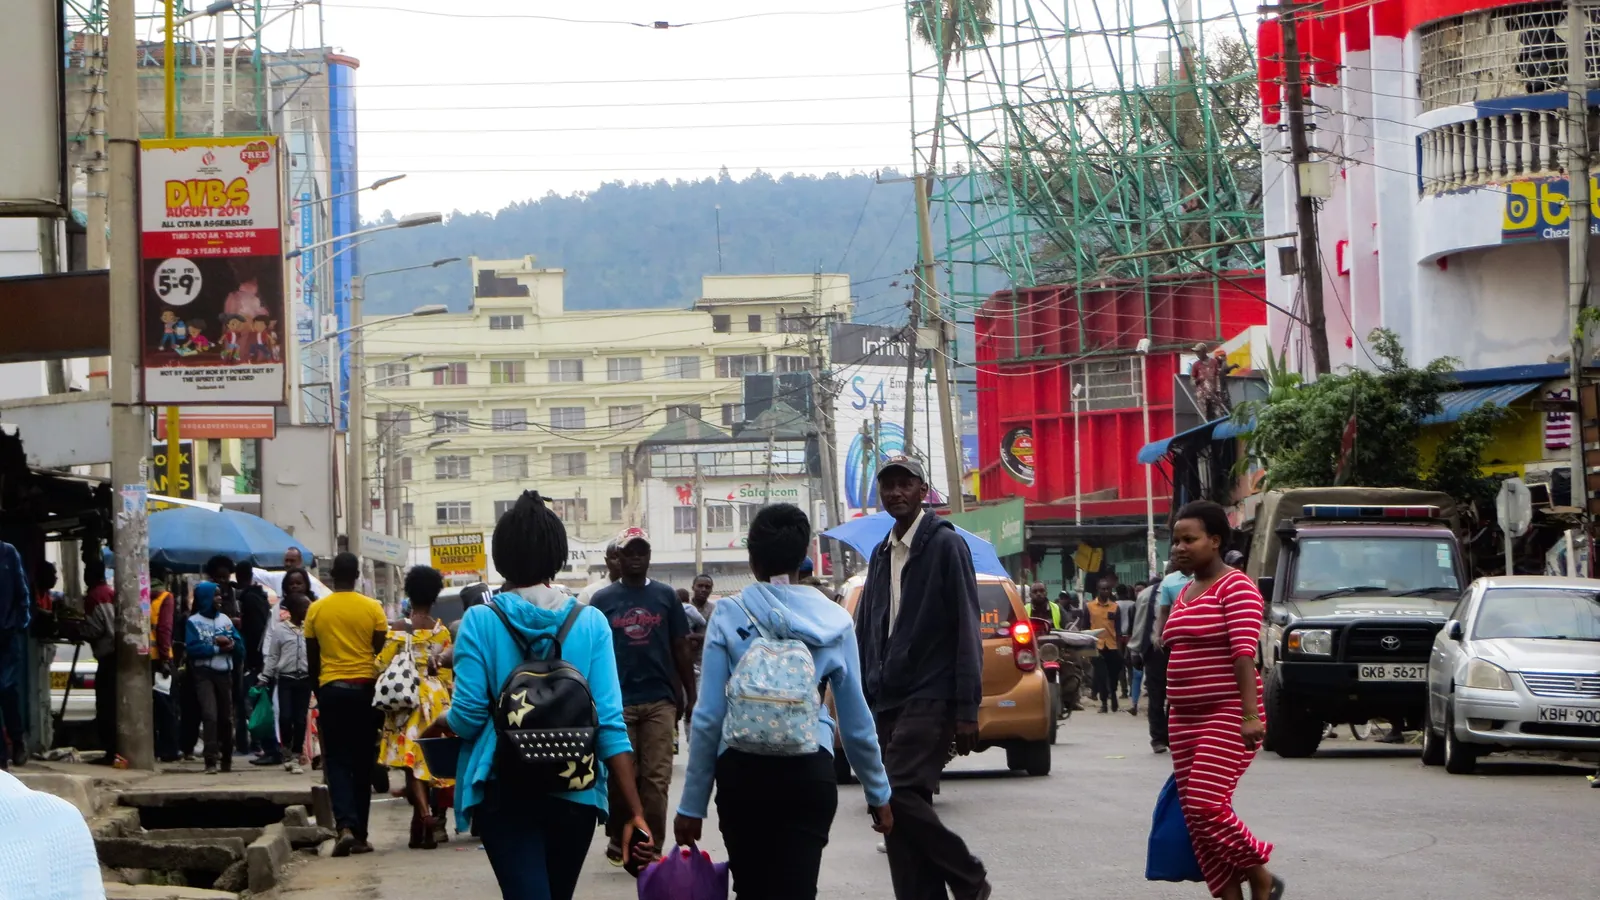
Public safety agencies monitoring large gatherings need real-time density and movement data. Crowd analytics can provide situational awareness to incident commanders without requiring individual identification or facial recognition.

governmentsmart city

Theme Park Queue and Zone Management

Theme parks must balance crowd load across attractions, dining areas, and pathways. Density analytics can power dynamic wait-time displays, crowd-level alerts to staff, and guest flow optimization throughout the park.

hospitalityevents

Technical overview

Models
CSRNet / CAN density regression models with optical flow (RAFT) for movement analysis
Input formats
RTSP, ONVIF, MP4, HLS, drone video feeds, fisheye/panoramic streams
Output formats
JSON, MQTT, Webhooks, GeoJSON (for map overlays), CSV, Prometheus metrics
Edge support
NVIDIA Jetson Orin, Intel NUC, any x86 with CUDA-capable GPU

Accuracy and latency are measured against your footage and cameras during pilot scoping; we publish figures only with the conditions they were measured under.

Evaluate Crowd Analytics on your footage

One prioritized outcome, your cameras, a structured results review.