ConductVision Enterprise

Sports & Entertainment

ConductVision counts restroom queues and plaza crowds and checks that staff posts stay covered through each event for stadium and arena operations teams.

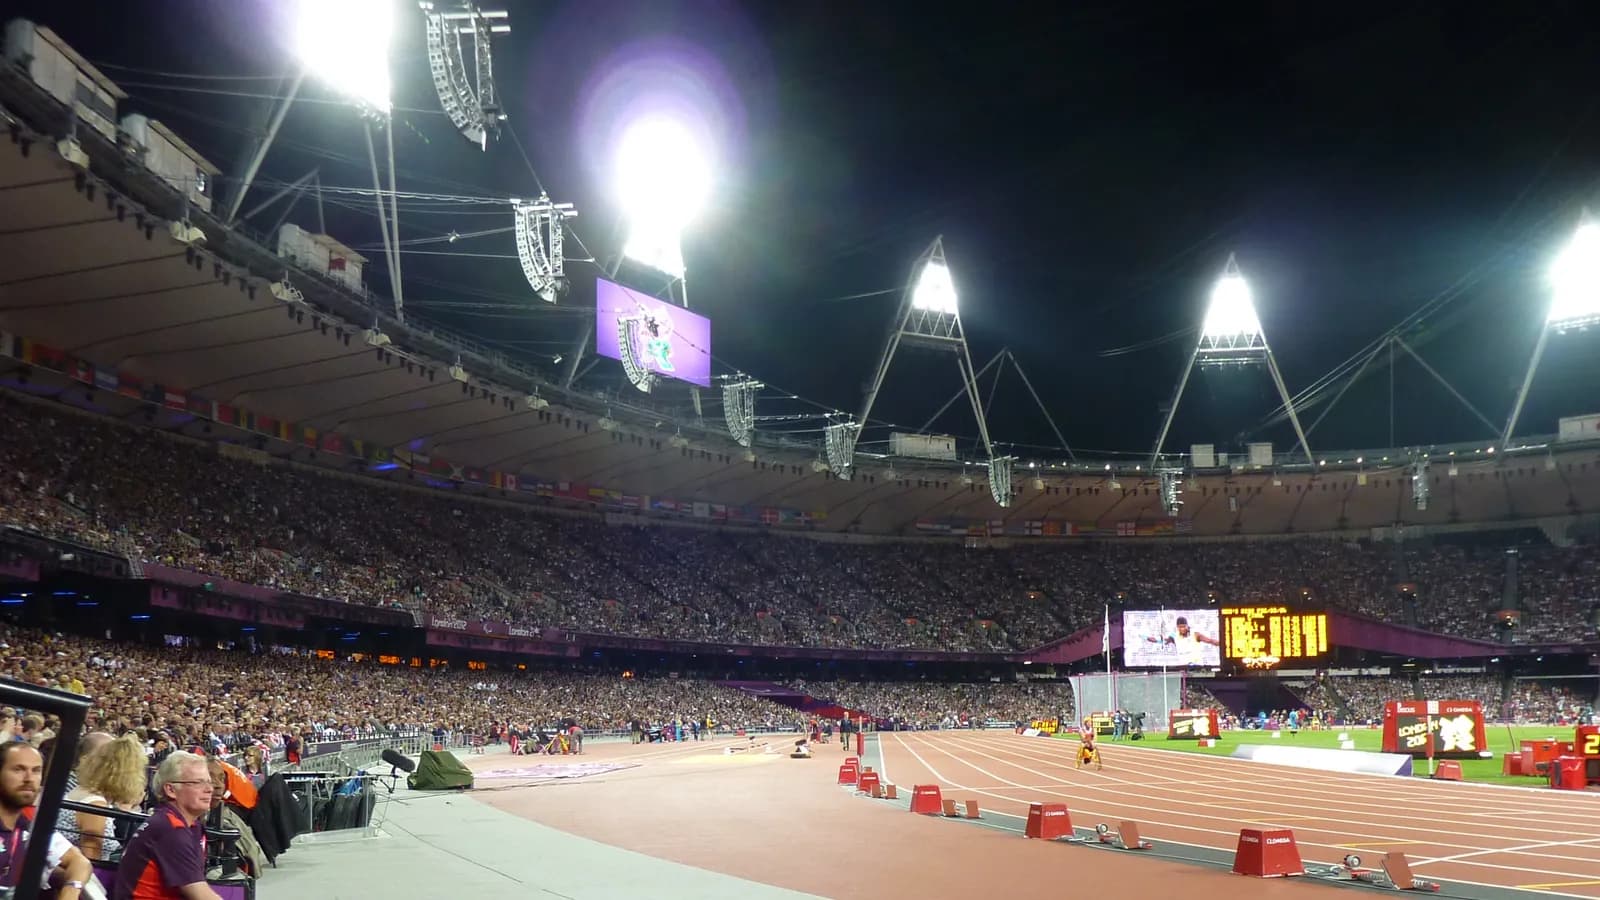
Spectators fill the stands under floodlights during an evening athletics meet; boxes mark 15 people in the nearest rows and beside the track.15 detections
Olympic Stadium in London at night
  • Person15

ConductVision detections on this photo. Photo: Thomas Davies from Brighton, United Kingdom, CC BY 2.0, cropped.

Stadiums, arenas, and entertainment venues host tens of thousands of attendees in concentrated spaces where crowd dynamics, security threats, and operational bottlenecks can escalate rapidly. Traditional venue management depends on control room operators watching banks of monitors and security personnel patrolling sections manually, an approach that scales poorly as venue capacity and event frequency increase. ConductVision's technology can transform venue camera networks into intelligent monitoring systems, providing real-time crowd density analytics, automated security alerting, ingress and egress optimization, and operational insights that enhance both safety and the attendee experience.

Outcomes

What your team gets

Restroom lines at the break

Restroom lines spike at halftime and intermissions, and some restrooms stay short while others overflow.

Fans stuck in long lines miss the restart and crowd the concourse.

How
ConductVision counts the people queued outside each restroom in the concourse views.
You get
Queue counts per restroom for each break, showing where to send attendants and signs.
Staff posts covered all event

Stewards and ushers hold assigned posts at section entrances, stairways and exits.

An empty post during egress leaves a stairway with no one to slow the flow.

How
In a pilot, ConductVision checks each post view for a person in a staff vest throughout the event.
You get
A coverage log per event listing which posts stood empty and for how many minutes.

Plaza crowds before gates open

Fans gather on the plaza before gates open, and the crowd builds against the barriers.

Without counts, the venue sets its next opening time and lane count from memory.

How
ConductVision counts the people in each plaza view before and after the gates open.
You get
Plaza counts by minute set against gate opening, for planning the next event.

The challenge

Large venues face simultaneous demands for rapid ingress processing, crowd density management across concourse and seating sections, incident detection in real time, and smooth egress after events conclude. Control room operators cannot effectively monitor hundreds of camera feeds simultaneously, and crowd crush risks in tunnels and concourses are difficult to predict from individual camera views alone.

Our approach

ConductVision can aggregate feeds from gate, concourse, seating bowl, and parking cameras to generate venue-wide crowd density maps in real time. Ingress rate monitoring can predict gate saturation and trigger lane rebalancing. Anomaly detection models can flag fights, medical events, and prohibited items, routing alerts to the nearest security team with precise location data.

What the model sees

Detections in two more settings

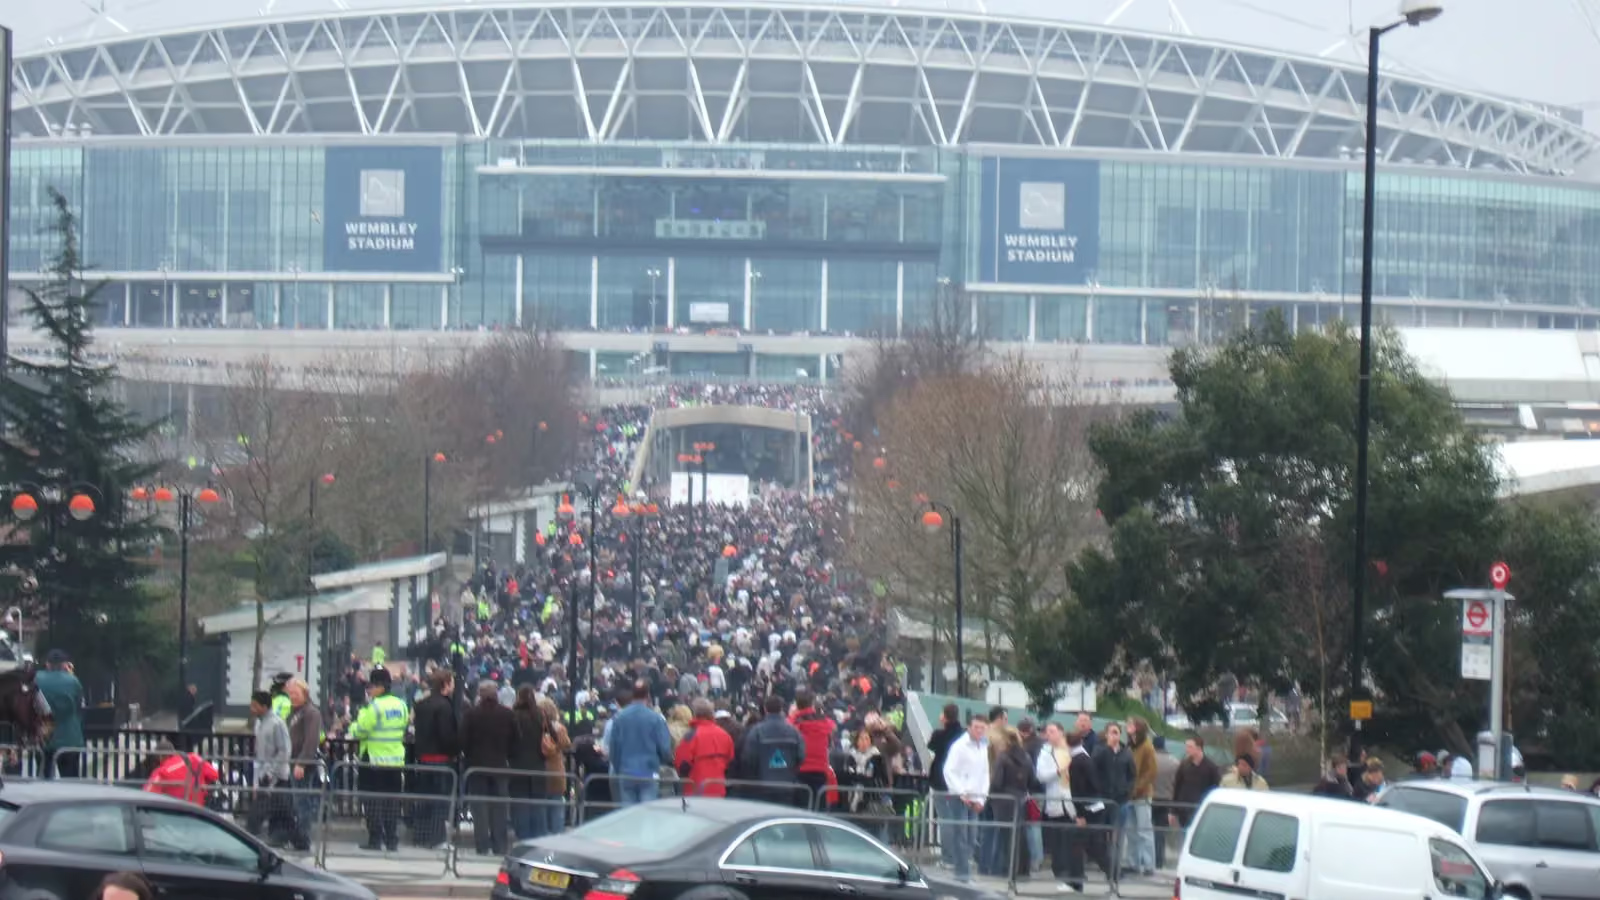
A large crowd streams along the approach to Wembley Stadium; boxes mark 30 people at the near edge of the crowd.
Crowd walking to Wembley Stadium
  • Person30

ConductVision detections on this photo. Photo: Richard Humphrey, CC BY-SA 2.0, cropped.

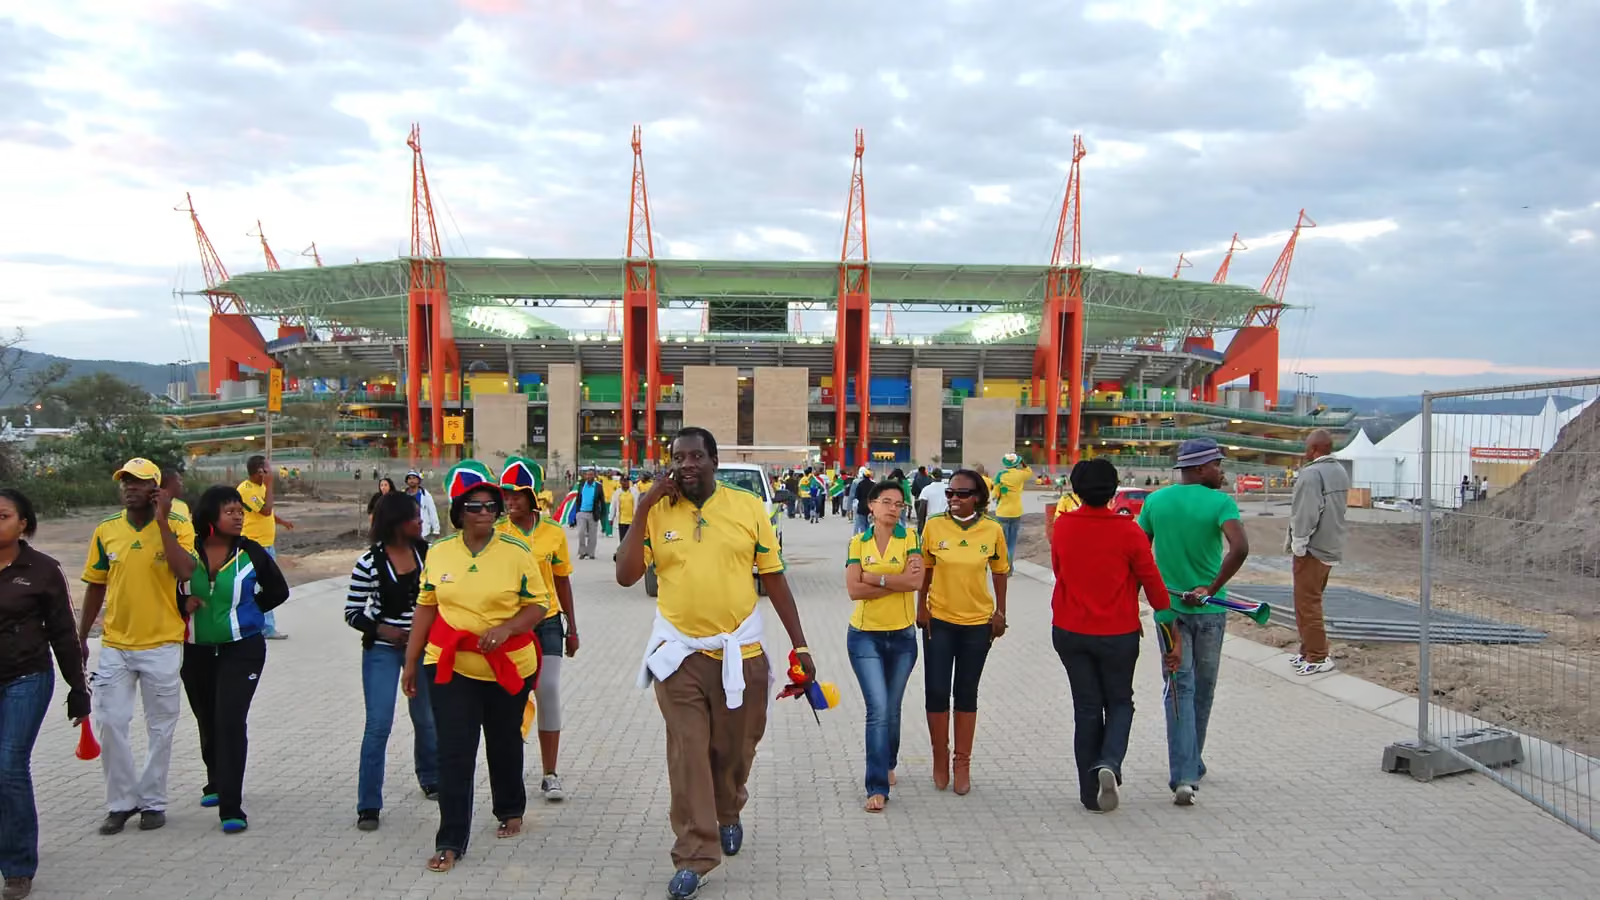
Fans in yellow team shirts walk away from Mbombela Stadium in South Africa; boxes mark 33 people.
Fans leaving Mbombela Stadium
  • Person33

ConductVision detections on this photo. Photo: Tadpolefarm, CC BY-SA 4.0, cropped.

Endpoints

What a pilot measures

Each endpoint is defined before the pilot starts, with what is counted, its unit and how the results are broken down.

What a pilot measures
PrimaryPost coverageShare of event minutes each assigned staff post has a person in a staff vest in view.Unit:%By:Post, event phase
SecondaryRestroom queue peakMost people counted in a restroom queue view during each break.Unit:people (peak per break)By:Restroom, break
Queue clearance timeMinutes from the start of a break until a restroom queue falls below five people.Unit:minutes (median)By:Restroom, break
Plaza build-upPeak count of people on the plaza in the 30 minutes before gates open.Unit:people (peak)By:Plaza zone, event

How we check the model

Each pilot measures ConductVision on your own footage against a sample checked by hand, before anyone relies on its numbers.

  • Crowd count agreement

    Difference between the ConductVision count and a reviewer's hand count on sampled frames of dense crowds.

    people per frame (mean absolute difference) · by camera, crowd density

  • Staff vest precision

    Share of people ConductVision marks as staff that a reviewer confirms in sampled stills.

    % · by post, light conditions

  • Empty-post alert precision

    Share of empty-post alerts that a reviewer confirms in a hand-checked sample of clips.

    % · by post

Use cases

Where teams put it to work

Stadium Crowd Density Management

Overhead and elevated cameras across concourses, gates, and seating sections can provide real-time occupancy counts by zone. When density thresholds approach unsafe levels in tunnels or vomitories, operations teams can receive alerts to redirect flow using dynamic signage and PA announcements.

Ingress and Egress Optimization

Gate cameras can measure throughput rates by entry point and ticket type in real time. When specific gates approach saturation, digital signage and mobile app notifications can redirect attendees to underutilized entries. Post-event egress monitoring can identify bottleneck zones and inform future traffic management planning.

Fan Zone and Concession Analytics

Cameras in concession areas, merchandise stands, and fan experience zones can measure dwell times, queue lengths, and traffic patterns. Data can inform staffing levels, stand layout optimization, and product placement decisions for subsequent events.

Security Incident Detection

Behavioral analytics can detect altercations, crowd surges, unattended bags, and medical distress events across the venue. Alerts can be routed to the nearest available security team with GPS-mapped camera locations and annotated video clips for rapid response.

Parking and Transportation Management

Parking structure and lot cameras can track vehicle occupancy by zone and level in real time, feeding availability data to mobile apps and variable message signs. Post-event, cameras can monitor lot clearance rates and identify pedestrian-vehicle conflict zones for safety improvements.

Player and Field Activity Tracking

Broadcast and training facility cameras can track player positions, movement speed, and formation patterns during games and practice sessions. Data can support coaching analytics, broadcast enhancement overlays, and performance benchmarking without requiring wearable sensors.

See also

A ConductVision Sports pilot measures shooting mechanics, athletic profiles and recruiting data for academy players from practice video.

Basketball academies

Systems it connects to

  • Venue Management Systems (VenueOps, Ungerboeck)
  • Ticketing Platforms (Ticketmaster, AXS)
  • Digital Signage Networks
  • Physical Security Information Management (PSIM)
  • Broadcast Production Systems

Pilot

Scope a sports & entertainment pilot

Tell us about your sites and cameras, and a ConductVision engineer replies with a scoping plan built around the endpoints above.