ConductVision Enterprise

Vehicle Detection

ConductVision counts cars, trucks, buses, motorcycles and bicycles by class on roads, junctions and lots, for traffic, parking and site teams.

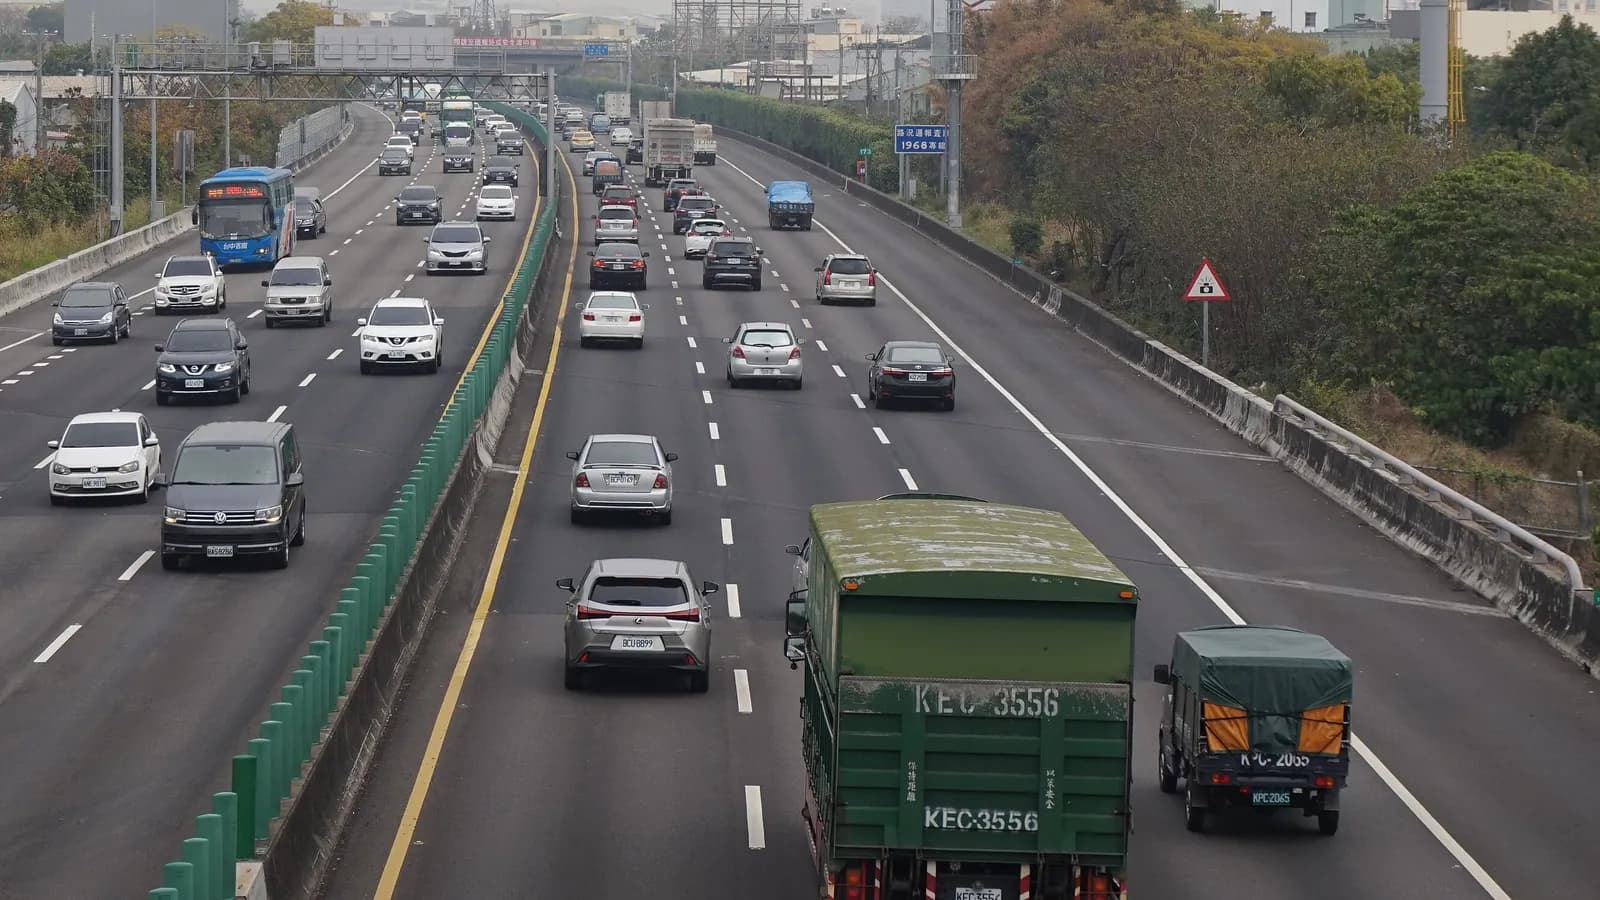
Northbound traffic on a six-lane freeway seen from an overpass; boxes mark 21 cars, 3 trucks and a bus.25 detections
Freeway 1 near Taichung
  • Truck3
  • Car21
  • Bus1

ConductVision detections on this photo. Photo: Alika113, CC BY-SA 4.0, cropped.

Vehicle Detection identifies and classifies cars, trucks, buses, motorcycles, and bicycles across multiple lanes and camera angles. The system can estimate speed, detect wrong-way travel, monitor parking occupancy, and count traffic volume by vehicle class. It is designed to integrate with existing traffic infrastructure via standard protocols and provides the data foundation for intelligent transportation systems. The models are designed to handle varied weather, lighting, and camera angles.

Outcomes

What your team gets

Two-wheelers in the count

Scooters and motorcycles weave between lanes and cross road sensors at odd angles.

Plans for two-wheeler lanes and parking rest on counts that may leave many of them out.

How
ConductVision boxes motorcycles and bicycles as their own classes, wherever they ride in the frame.
You get
Two-wheeler counts by approach and hour, beside the car and truck counts.

Overflow parking on busy days

When the main lot fills, visitors park along shoulders, access roads and no-parking areas.

Staff learn the lot overflowed from blocked roads and complaints, after the fact.

How
In a pilot, ConductVision counts the cars and pickups parked in each drawn area, including roadsides outside the marked bays.
You get
Hours each day when the lot was full, and the number of vehicles parked outside it.

Bus arrivals at entrances

Coaches and buses reach visitor sites and terminals in bunches.

Drop-off bays overflow and buses wait on the road while staff scramble.

How
ConductVision counts buses apart from cars and trucks at each entrance, with the time each one arrives.
You get
Bus arrivals by entrance and hour, to plan bays and staff for the busy hours.

Counts with the frames behind them

A traffic count from a box on a pole is hard to defend when residents dispute it.

Studies get repeated, or decisions wait, because nobody can show how the number was made.

How
Every count keeps the frames it came from, with a box and class on each vehicle.
You get
A count anyone can audit by opening the frames for a given lane and hour.

What the model sees

Detections in two more settings

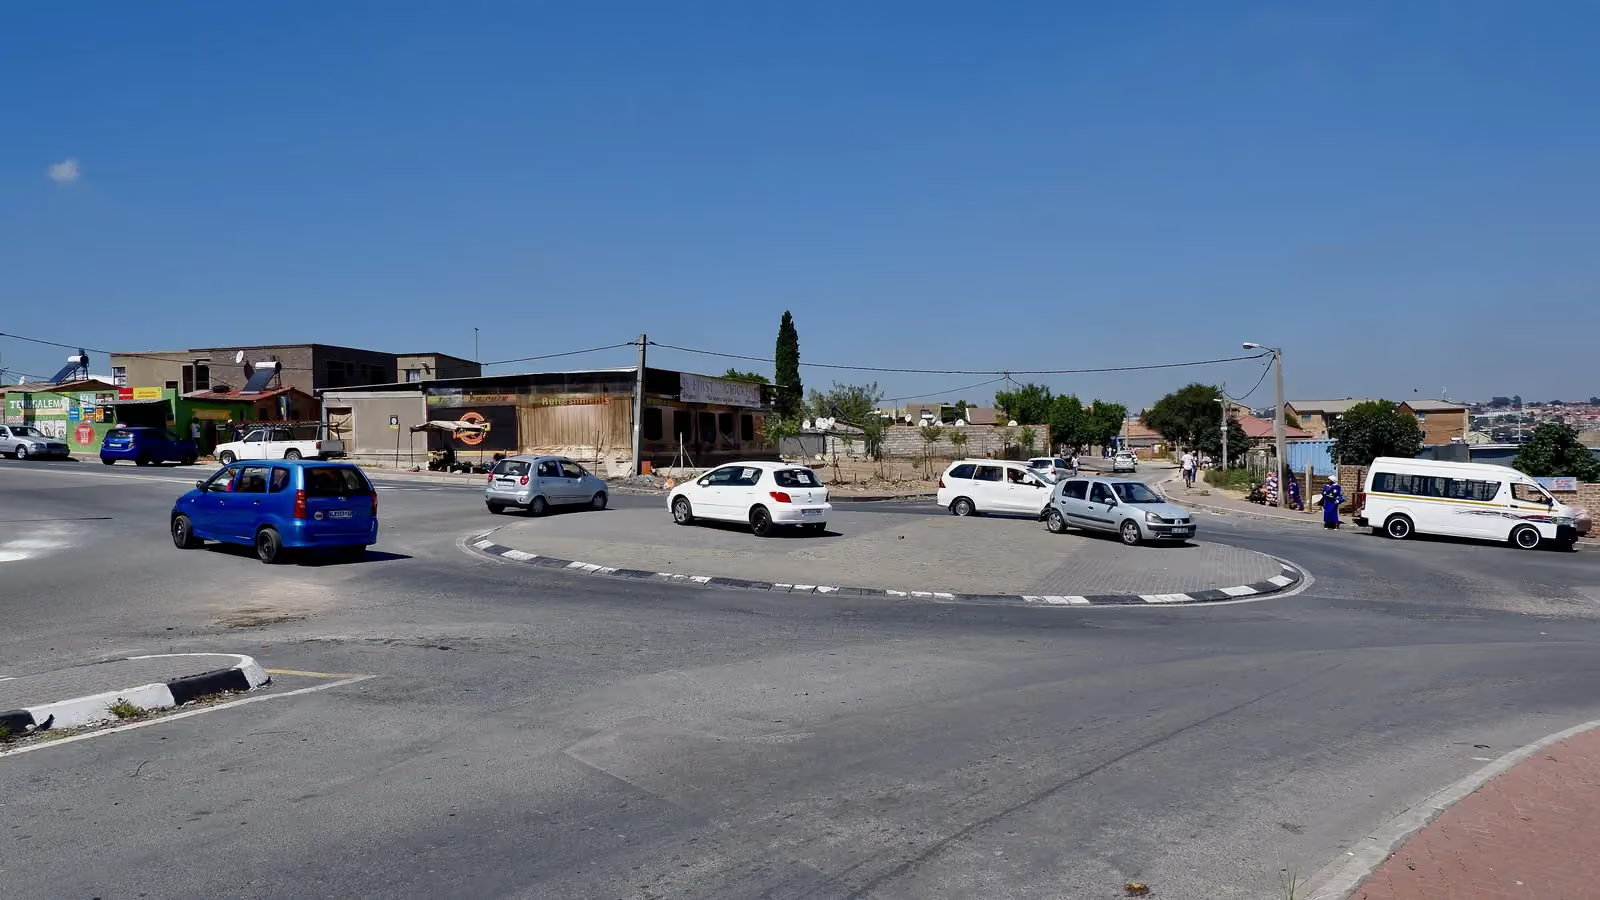
Taxis, cars and scooters cross a busy junction in Dakar; boxes mark 14 cars and 2 motorcycles.
Busy intersection in Dakar
  • Car14
  • Motorcycle2

ConductVision detections on this photo. Photo: Ruth Zurielly Jennings, CC BY-SA 4.0, cropped.

A full parking lot at a national park visitor center seen from a hillside; boxes mark 17 cars and 2 pickup trucks.
Visitor center parking lot
  • Car17
  • Truck2

ConductVision detections on this photo.

Endpoints

What a pilot measures

Each endpoint is defined before the pilot starts, with what is counted, its unit and how the results are broken down.

What a pilot measures
PrimaryClassified volumeVehicles crossing each count line, by class, summed per hour.Unit:vehicles per hourBy:Lane or approach, class
SecondaryTwo-wheeler shareShare of all vehicles counted at a site that are motorcycles or bicycles.Unit:%By:Approach, hour
Lot full hoursHours in which every marked space in a lot holds a vehicle in the sampled frames.Unit:hours per dayBy:Lot, day
Overflow vehiclesVehicles parked in drawn areas outside the marked bays, reported as the daily peak.Unit:vehiclesBy:Area, day

How we check the model

Each pilot measures ConductVision on your own footage against a sample checked by hand, before anyone relies on its numbers.

  • Count agreement

    Difference between the ConductVision count and a reviewer's hand count over the same sampled 15-minute periods, by class.

    vehicles per period (mean absolute difference) · by class, light level

  • Class agreement

    Share of counted vehicles whose class matches the label a reviewer gives on sampled frames.

    % · by class

  • Missed two-wheelers

    Share of motorcycles and bicycles a reviewer marks in sampled frames that ConductVision did not box.

    % · by camera, distance band

How it works

Vehicle Detection in three steps

  1. Connect

    Connect Traffic Cameras

    Mount cameras at intersections, highway overpasses, or parking entrances and connect via RTSP or ONVIF. The calibration wizard maps pixel coordinates to real-world distances for speed estimation.

  2. Analyze

    AI Classifies Every Vehicle

    Each frame is processed by a multi-class detection model that identifies vehicle type, bounding box, and direction of travel. A tracking algorithm assigns persistent IDs to vehicles across frames for trajectory analysis.

  3. Act

    Generate Traffic Intelligence

    Wrong-way detections, speed violations, and parking events trigger alerts. Aggregated traffic counts and speed distributions feed into dashboards or third-party traffic management platforms via API.

What it detects

Classes the models report

  • Car

    Each car in view, counted per lane, count line or lot area

  • Truck

    Pickups, vans and heavy trucks, counted apart from cars

  • Bus

    Buses and coaches, counted by entrance and lane

  • Motorcycle

    Motorcycles and scooters, including those riding between lanes

  • Bicycle

    Bicycles in lanes, on shoulders and at crossings

Features

What the system does

Multi-Class Classification
Distinguishes between cars, SUVs, trucks, buses, motorcycles, bicycles, emergency vehicles, and heavy commercial vehicles in a single inference pass.
Speed Estimation
Calibrated camera geometry enables per-vehicle speed estimation without radar. Accuracy within +/-5 km/h under standard mounting conditions.
Wrong-Way Detection
Flags vehicles traveling against the designated flow direction on one-way streets, highway ramps, or parking structures, triggering alerts.
Parking Occupancy Monitoring
Tracks individual parking spaces or lot zones, reporting real-time availability percentages and historical utilization patterns.
Lane-by-Lane Volume Counting
Counts vehicles per lane per time interval, classified by type. Data exports support standard traffic engineering formats.
Incident Detection
Identifies stopped vehicles, sudden deceleration patterns, and debris on roadways. Alerts can be routed to traffic management centers.
Night and Adverse Weather Mode
Enhanced preprocessing for low-light and rain/fog conditions maintains strong classification performance in degraded visibility.

Use cases

Where teams put it to work

Intersection Traffic Studies

Transportation engineers need turning-movement counts at intersections. Vehicle Detection can provide 24/7 automated counts by vehicle class and direction, replacing manual counting crews.

smart citytransportation

Highway Speed Monitoring

Agencies monitor speed compliance on highways and work zones. Camera-based speed estimation can provide continuous data without installing in-road sensors.

transportationgovernment

Smart Parking Management

Parking operators often lose revenue from inaccurate availability data. Real-time space monitoring can drive accurate guidance signage and mobile app availability updates.

smart cityreal estateretail

Loading Dock Management

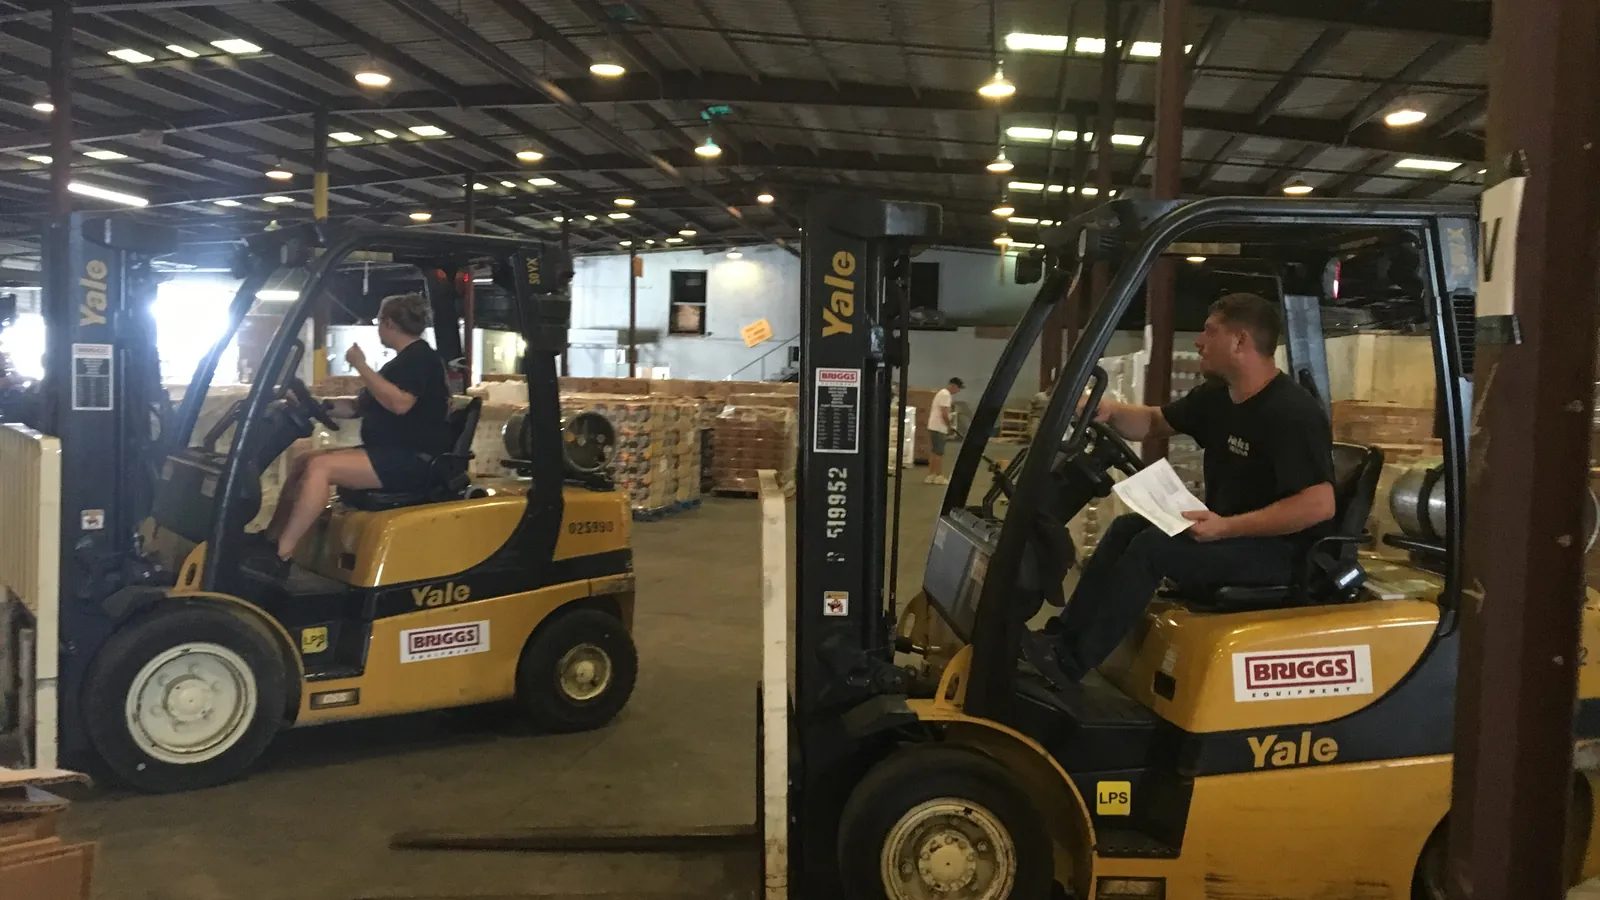
Warehouses need to track truck arrivals, dwell times, and bay utilization. Vehicle Detection can log every dock event with timestamps and vehicle classification.

logisticsmanufacturing

Campus and Gated Community Access

Gated communities and corporate campuses need to monitor vehicle flow without stopping traffic. Automated classification and counting can enable gateless access management.

corporatereal estate

Construction Zone Safety

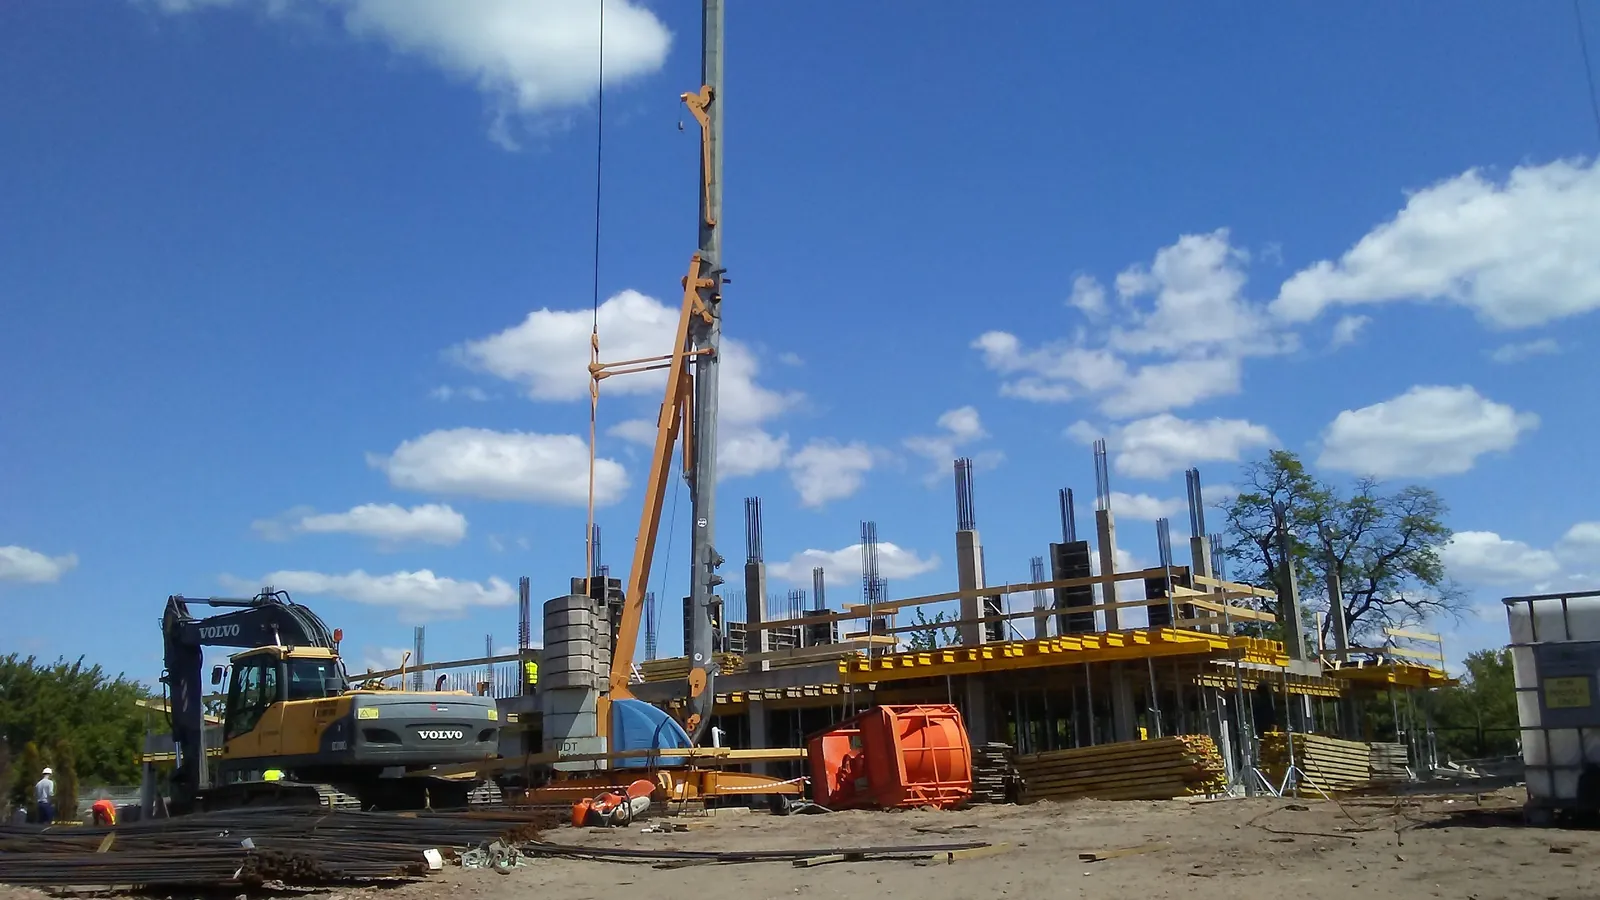
Wrong-way and speed violations in construction zones put workers at risk. Alerts to site supervisors can enable rapid response to dangerous driving behavior.

constructiongovernment

Traffic Flow Optimization

The challenge

Static signal timing cannot adapt to fluctuating traffic volumes, leading to unnecessary congestion and increased commute times.

How ConductVision helps

ConductVision can count and classify vehicles in real time at each approach. This data can feed into traffic management systems to enable adaptive signal timing, reducing average wait times and smoothing flow across arterial corridors.

smart cityinfrastructureautomotive

Pedestrian Safety

The challenge

Pedestrian-vehicle conflicts at crosswalks and intersections cause thousands of injuries each year, often at locations with poor visibility.

How ConductVision helps

The platform can detect pedestrians entering crosswalks and monitor approaching vehicle speeds. When a conflict is imminent, the system can trigger extended walk signals or flash warning beacons, and it can log all near-miss events for safety planning.

smart cityinfrastructure

Wrong-Way Detection

The challenge

Wrong-way drivers on highway ramps and one-way streets cause high-severity head-on collisions, and existing detection methods are unreliable.

How ConductVision helps

ConductVision can identify vehicles traveling against the designated flow and trigger alerts to traffic management centers. Notification can feed dynamic message signs, ramp closures, and law enforcement dispatch.

smart cityinfrastructure

Parking Management

The challenge

Drivers circling for parking increase congestion and emissions, while operators lack accurate occupancy data for their lots and garages.

How ConductVision helps

The platform can monitor individual parking spaces and lot entries, providing real-time occupancy counts and availability maps. Integration with signage and mobile apps can guide drivers directly to open spots, reducing search time and improving lot utilization.

smart cityretaillogistics

Bus Lane Enforcement

The challenge

Unauthorized vehicles in bus lanes slow transit service and undermine investments in dedicated infrastructure.

How ConductVision helps

ConductVision can detect non-transit vehicles occupying bus lanes and capture license plate images as evidence. Automated enforcement data can integrate with citation systems, deterring violations and maintaining transit schedule reliability.

smart cityinfrastructure

Intersection Monitoring

The challenge

Red-light running and turning conflicts at intersections are leading causes of urban crashes, and manual review of footage is impractical at scale.

How ConductVision helps

The platform can analyze vehicle trajectories through intersections in real time, detecting red-light violations, illegal turns, and near-miss events. Aggregated data can reveal the most dangerous movements at each intersection, informing engineering countermeasures.

smart cityinfrastructure

Speed Detection

The challenge

Excessive speed in school zones, work zones, and residential areas increases crash severity, but radar-based enforcement covers only a few locations.

How ConductVision helps

ConductVision can estimate vehicle speeds by tracking position across frames, identifying speeders in designated zones. This data can support enforcement operations and provide before-and-after metrics for traffic calming measures.

smart cityconstructioninfrastructure
Technical overview

Inputs, outputs and hardware

Accuracy and speed are measured on your footage and cameras during the pilot, and reported with the conditions they were measured under.

Models
Vehicle detector and tracker (YOLO family) for cars, trucks, buses, motorcycles and bicycles
Input formats
RTSP, ONVIF, MP4, HLS
Output formats
JSON, MQTT, Webhooks, CSV, NTCIP-compatible
Hardware
NVIDIA Jetson Orin, roadside compute units, any x86 with CUDA GPU

Pilot

Evaluate vehicle detection on your footage

A pilot takes one prioritized outcome, runs on your cameras, reports the endpoints above and ends with a results review and a decision.