ConductVision Enterprise

Education

ConductVision counts walkers, cyclists, parked bikes and event crowds across campus grounds for the facilities and events teams who plan paths, racks and outdoor space.

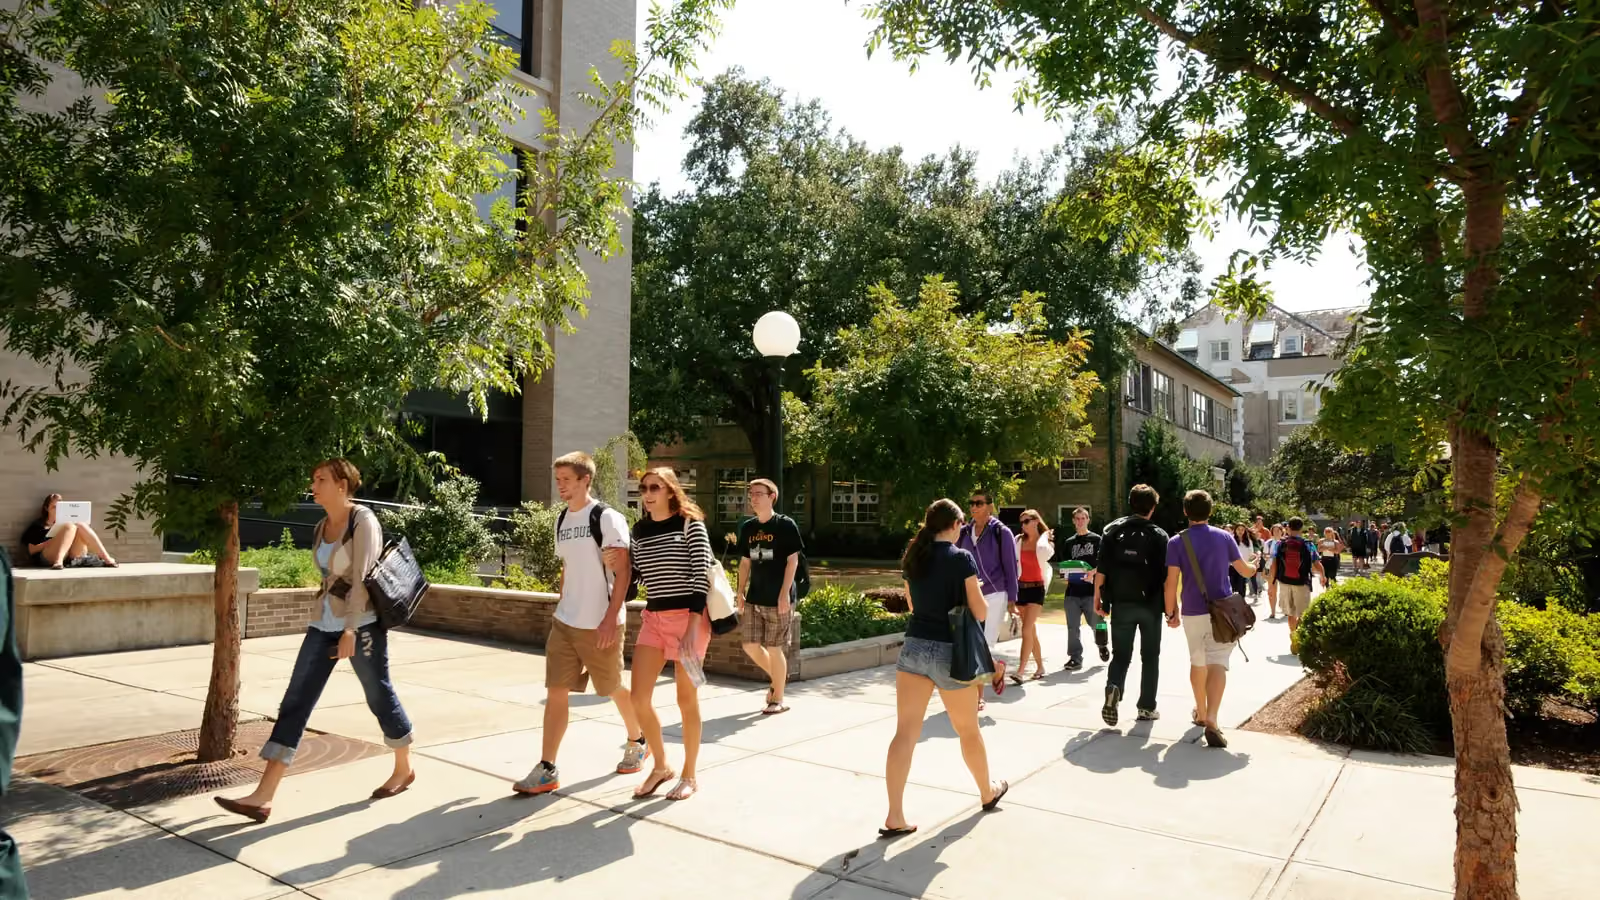
Students walk along a shaded campus walkway at Tulane University in New Orleans while one works on a laptop nearby; boxes mark 20 people and 3 backpacks.23 detections
Campus walkway at Tulane University
  • Person20
  • Backpack3

ConductVision detections on this photo. Photo: Tulane Public Relations, CC BY 2.0, cropped.

Educational institutions face a unique combination of security, safety, and operational challenges across sprawling campuses that serve diverse populations on complex schedules. Perimeter security, building access control, bus zone safety, and facility utilization all require monitoring that scales beyond the capacity of traditional security staffing. ConductVision's technology is well-suited for educational environments, providing campus perimeter monitoring, capacity management, transportation zone safety, and unauthorized access detection that respects privacy while delivering actionable security intelligence. The platform can help administrators maintain safe environments without creating an oppressive surveillance atmosphere.

Outcomes

What your team gets

Bike racks where riders park

Racks overflow at some buildings while others stand empty, and new rack requests come from complaints.

Bikes end up locked to rails, trees and ramps beside the full racks.

How
ConductVision counts the bicycles parked in each rack view through the day.
You get
Peak and average rack use per building by weekday, ready for the next rack order.
Walkers and cyclists on shared paths

Main paths carry walkers, cyclists and scooters at once when classes change.

Facilities cannot tell which path segments get busy enough to need a separate bike lane.

How
ConductVision counts the people and bicycles crossing each path segment every ten minutes.
You get
Counts of walkers and cyclists per path segment around class changes, by weekday.

Use of lawns, plazas and seating

Grounds teams plan outdoor seating, shade and lighting with no count of who uses each space.

Money for benches and lights can go to spaces that stay empty most of the day.

How
ConductVision counts the people in each lawn, plaza and seating area from frames sampled each hour.
You get
Hourly use of each outdoor space by weekday and season.

Crowds at move-in and graduation

Move-in day and graduation bring crowds the campus sees only a few days a year.

Plans for next year rest on staff memory of where lines formed and how long they lasted.

How
ConductVision counts the people in each zone at entrances, drop-off points and walkways during the event.
You get
A zone-by-zone record of peak crowding and when it happened, for next year's plan.

The challenge

Campuses have multiple entry points, open perimeters, and building access patterns that change hourly. Bus loading zones present concentrated pedestrian-vehicle conflict risks during narrow time windows. Classroom and facility utilization data is typically estimated rather than measured, leading to inefficient space allocation.

Our approach

ConductVision can monitor campus perimeters and building entries for unauthorized access patterns without facial recognition. Bus zone cameras can detect pedestrian-vehicle proximity risks and verify orderly loading sequences. Classroom and facility occupancy sensors can provide utilization data that informs scheduling and capital planning.

What the model sees

Detections in two more settings

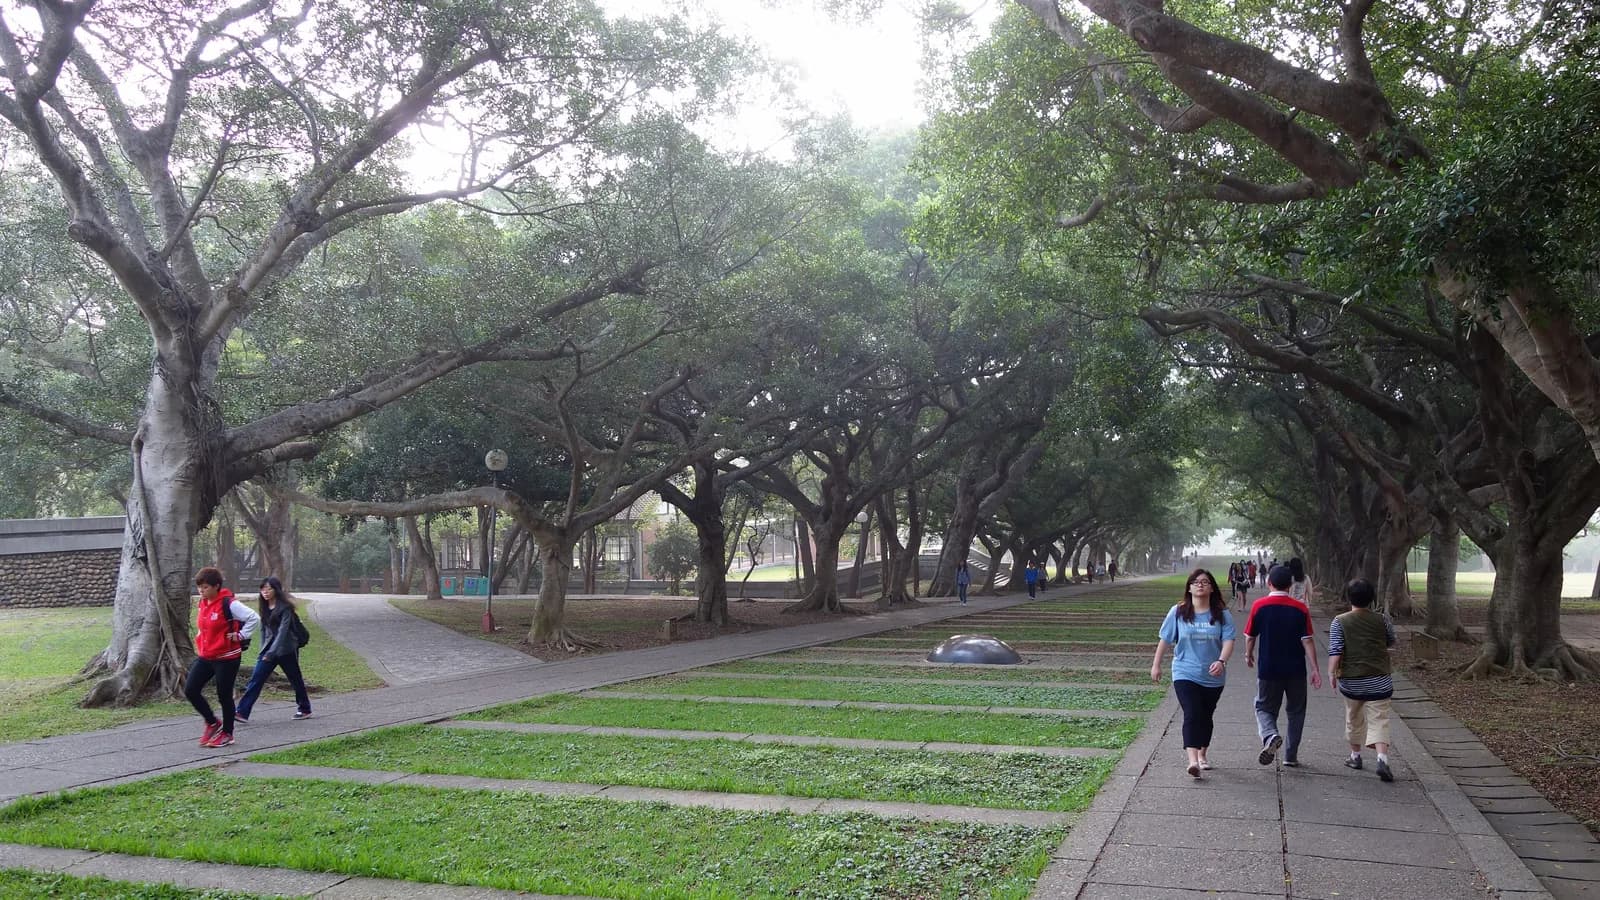
People walk along the shaded Wenli Boulevard at Tunghai University in Taichung, Taiwan; boxes mark 16 people and 1 backpack.
Wenli Boulevard at Tunghai University
  • Person16
  • Backpack1

ConductVision detections on this photo.

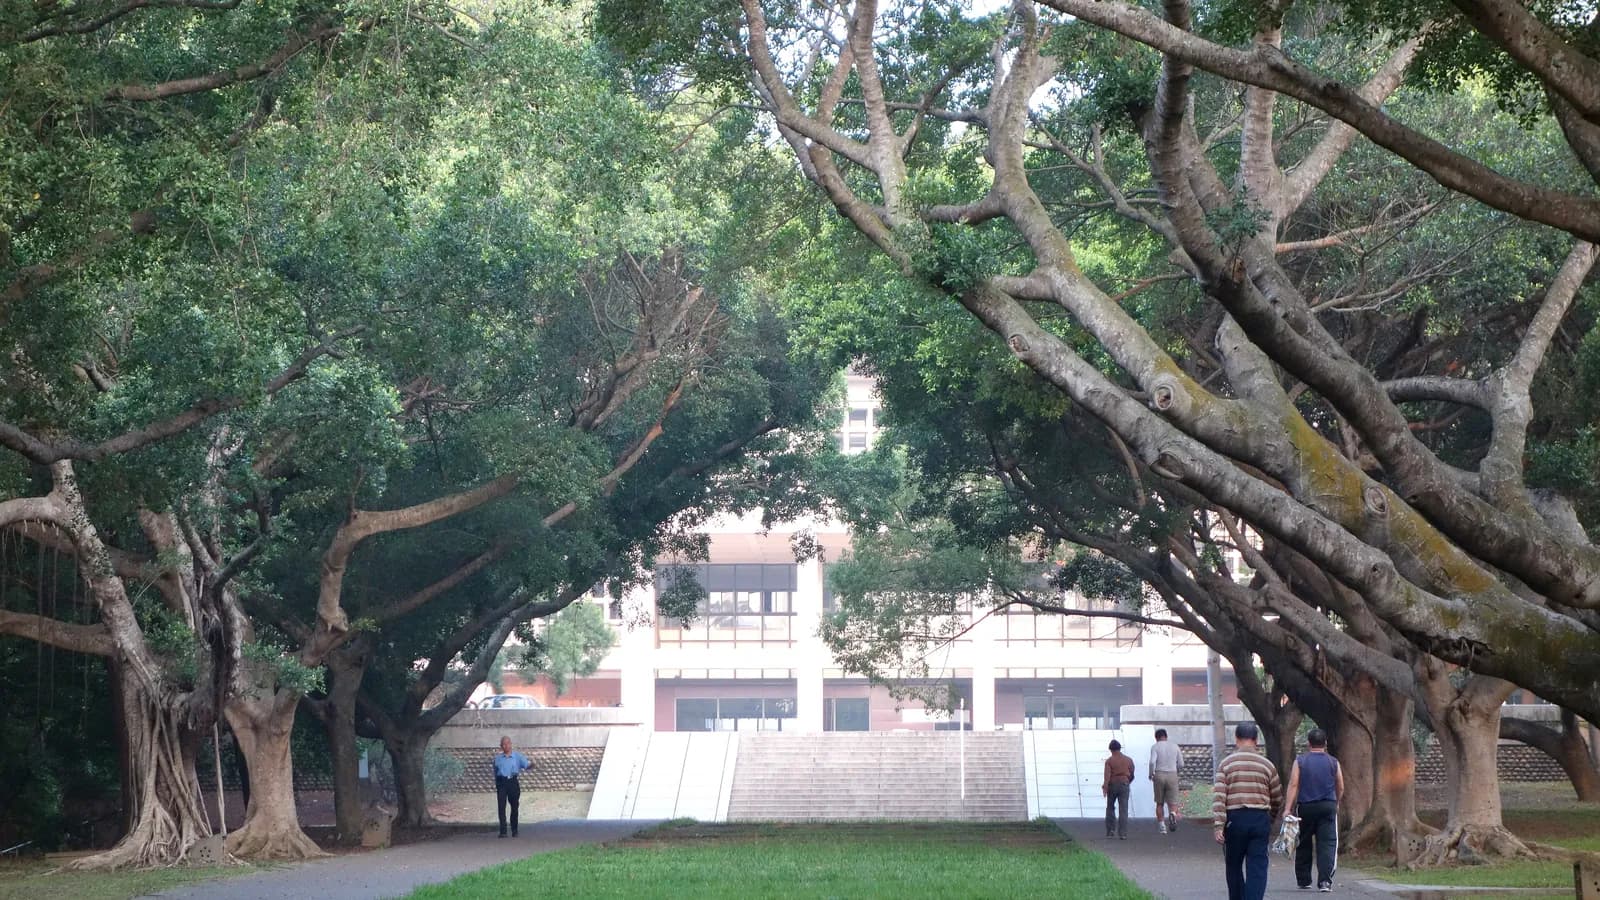
Walkers pass under large shade trees on the boulevard leading to the library at Tunghai University in Taichung, Taiwan; boxes mark 5 people.
Library approach at Tunghai University
  • Person5

ConductVision detections on this photo.

Endpoints

What a pilot measures

Each endpoint is defined before the pilot starts, with what is counted, its unit and how the results are broken down.

What a pilot measures
PrimaryPeak path volumeWalkers and cyclists counted crossing a path segment in its busiest 15 minutes of the day.Unit:people per 15 minutesBy:Path segment, weekday
SecondaryBike rack fillBicycles counted in a rack view divided by the rack's spaces, at the daily peak.Unit:%By:Building, weekday
Outdoor space usePeople counted in each outdoor space, as the mean of the frames sampled in each hour.Unit:people (hourly mean)By:Space, hour, season
Event zone peakHighest count of people in a zone during an event, with the time it occurred.Unit:peopleBy:Zone, event

How we check the model

Each pilot measures ConductVision on your own footage against a sample checked by hand, before anyone relies on its numbers.

  • Count agreement

    Difference between the ConductVision count and a reviewer's hand count on a sample of frames.

    people per frame (mean absolute difference) · by camera, crowd size

  • Bicycle recall

    Share of parked bicycles a reviewer counts in sampled rack stills that ConductVision also detected.

    % · by rack, light conditions

  • Crossing tally agreement

    Difference between the ConductVision path crossings and a reviewer's tally over sampled 15-minute periods.

    crossings per period (mean absolute difference) · by path segment

Use cases

Where teams put it to work

Campus Perimeter Security

Cameras at campus boundaries can detect after-hours intrusions, vehicle loitering, and perimeter breaches. Alerts can be classified by time, zone, and behavioral pattern, enabling security teams to prioritize responses without monitoring every feed continuously.

Bus Zone Safety Monitoring

Cameras at bus loading areas can detect students in vehicle paths, vehicles violating stop-arm signals, and pedestrian-bus proximity risks. Real-time alerts can reach transportation supervisors during the critical arrival and dismissal windows.

Building Access Monitoring

Entry cameras can detect tailgating through secured doors, propped-open emergency exits, and unusual access patterns outside of scheduled hours. Alerts can be integrated with access control systems for correlated event analysis.

Classroom and Facility Utilization

Occupancy counting in classrooms, libraries, gymnasiums, and common areas can provide actual utilization data. Scheduling systems can receive empirical usage patterns that inform room assignment optimization and capital investment decisions.

Emergency Gathering Point Verification

During drills and actual evacuations, cameras at designated gathering points can provide headcount estimates to incident commanders. Zone-level occupancy before and after evacuation can help identify areas that may still have occupants.

Parking and Traffic Flow Management

Campus parking lots and internal roadways can be monitored for occupancy, traffic flow, and pedestrian conflict zones. Data can inform parking permit allocation, shuttle routing, and infrastructure improvement planning.

Systems it connects to

  • Access Control Systems (Genetec, Lenel)
  • Student Information Systems (SIS)
  • Mass Notification Platforms
  • Bus Fleet Management Systems
  • Facility Scheduling Software

Pilot

Scope a education pilot

Tell us about your sites and cameras, and a ConductVision engineer replies with a scoping plan built around the endpoints above.