ConductVision Enterprise

Infrastructure

ConductVision counts trucks, buses and cars on bridges and detour routes and logs people on rail bridges and vehicles inside road work zones for asset owners.

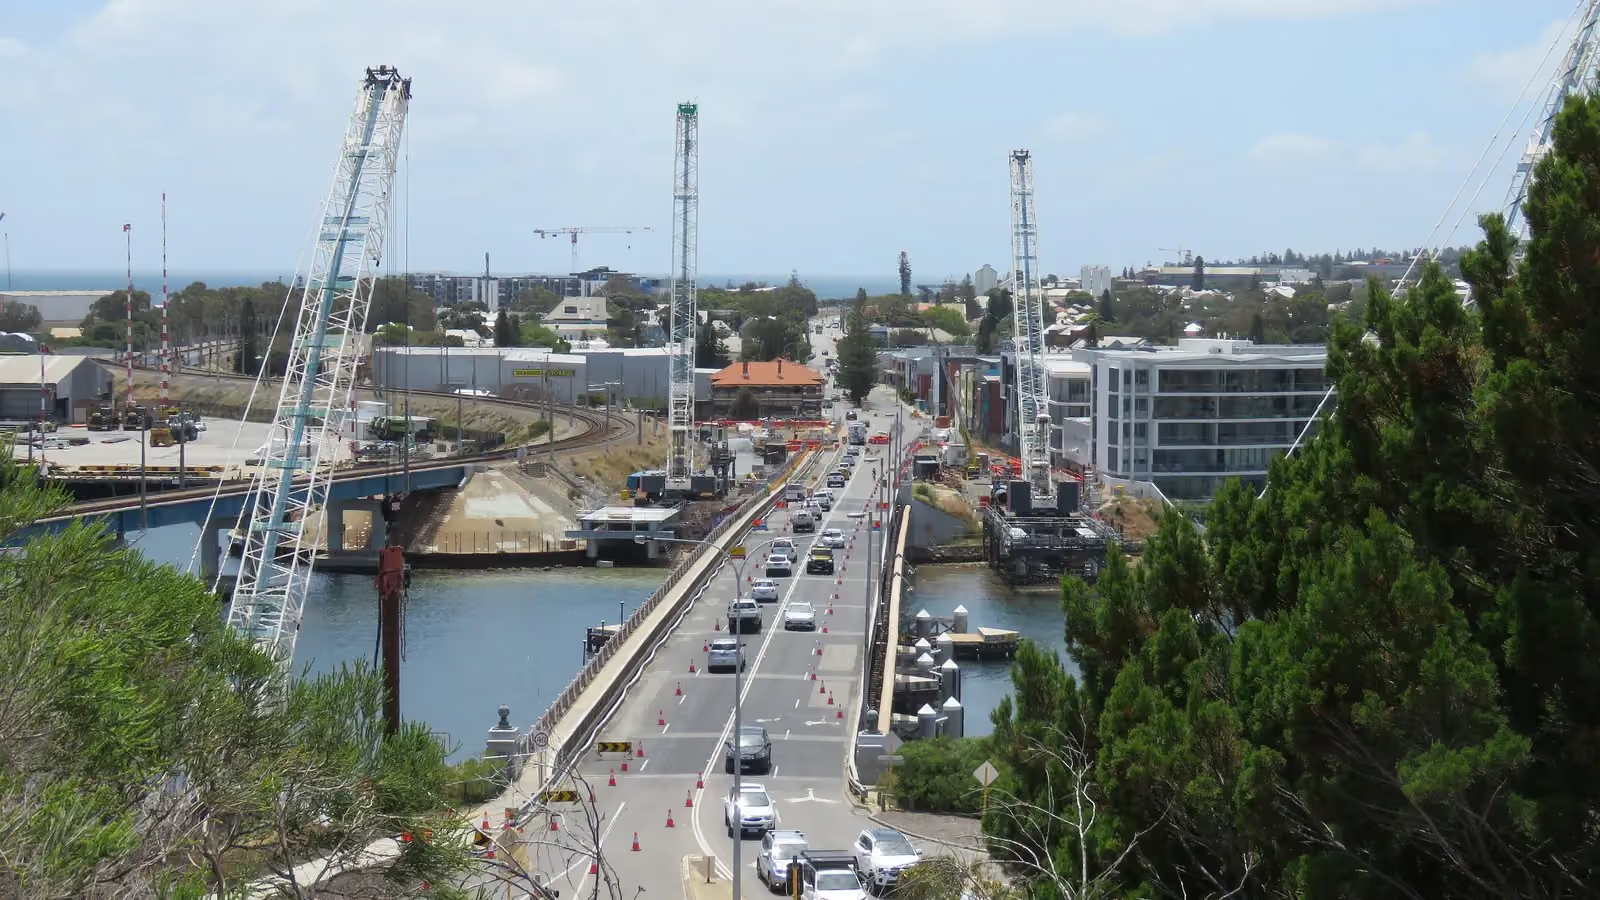
Traffic crosses the Fremantle Traffic Bridge in Western Australia beside the cranes building its replacement, seen from Cantonment Hill; boxes mark 22 cars and 2 trucks.24 detections
Bridge replacement in Fremantle
  • Car22
  • Truck2

ConductVision detections on this photo. Photo: Calistemon, CC BY-SA 4.0, cropped.

Bridges, roads, dams, tunnels, and utility networks form the backbone of modern society, yet inspection and maintenance of these assets rely heavily on periodic manual assessments that are expensive, slow, and limited by accessibility. Structural degradation often progresses undetected between inspection cycles, and the consequences of failure are severe. ConductVision's technology can enable continuous or high-frequency visual monitoring of infrastructure assets using fixed cameras, drone imagery, and mobile inspection platforms. Crack propagation, surface deterioration, deformation, and environmental damage can be detected and tracked over time, providing asset managers with objective condition data between traditional inspection intervals.

Outcomes

What your team gets

Truck crossings on posted bridges

Older bridges carry weight limits, and engineers rarely know how many heavy trucks still cross them.

Load ratings and repair plans then rest on traffic estimates for that structure.

How
ConductVision detects trucks and buses on the deck and counts each crossing by direction.
You get
Hourly heavy-vehicle crossings for each bridge, with stills for the enforcement team.
Vehicles inside road work zones

Road crews work beside live traffic, and the crew lead cannot watch the cones and the work at once.

A car that drifts inside the coned area is a near miss that goes unreported.

How
In a pilot, ConductVision flags any vehicle that crosses into the coned work area set for each view.
You get
A log of work-zone intrusions by lane and hour, with a clip of each.

People on rail bridges

People walk across rail bridges and along tracks where no path exists.

Without counts, owners cannot show which structures need fencing or signs.

How
ConductVision detects people and trains in each track view and logs every person on the structure.
You get
Trespass counts per bridge by hour, with stills of each crossing.

Traffic during lane closures

A lane closure for repairs pushes traffic onto detours that no one counts.

Planners set the next closure window without knowing how traffic responded to the last one.

How
ConductVision counts cars, trucks and buses on the main route and the detour in each camera view.
You get
Hourly vehicle counts on both routes before, during and after each closure.

The challenge

Critical infrastructure inspection cycles are measured in months or years, creating windows where deterioration can progress unchecked. Manual inspection of bridges, tunnels, and dams is constrained by accessibility, weather, and traffic disruption. Utility pole and transmission line inspection across thousands of miles is extraordinarily labor-intensive.

Our approach

ConductVision can process imagery from permanently installed cameras and periodic drone flights to detect cracks, spalling, corrosion, vegetation encroachment, and structural deformation. Change detection algorithms can track progression over time, and severity classifications can prioritize maintenance scheduling.

What the model sees

Detections in two more settings

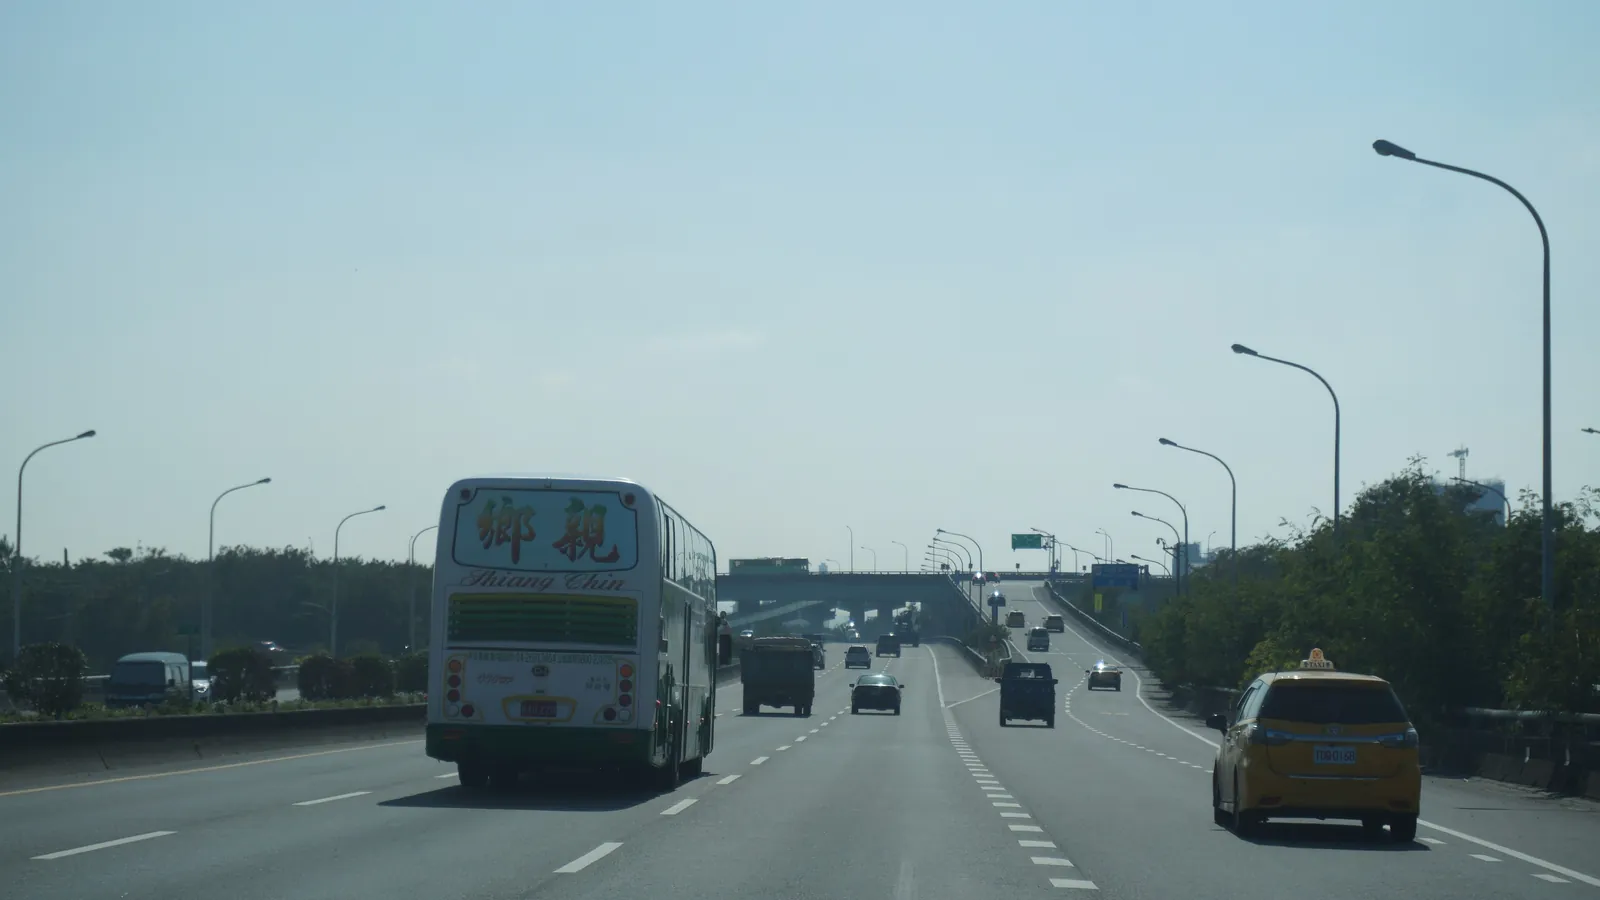
Traffic on Highway 74 near the Taichung high speed rail interchange in Taiwan; boxes mark a coach, 10 cars and a truck.
Highway 74 in Taichung
  • Bus1
  • Car10
  • Truck1

ConductVision detections on this photo. Photo: Tbatb, CC BY-SA 4.0, cropped.

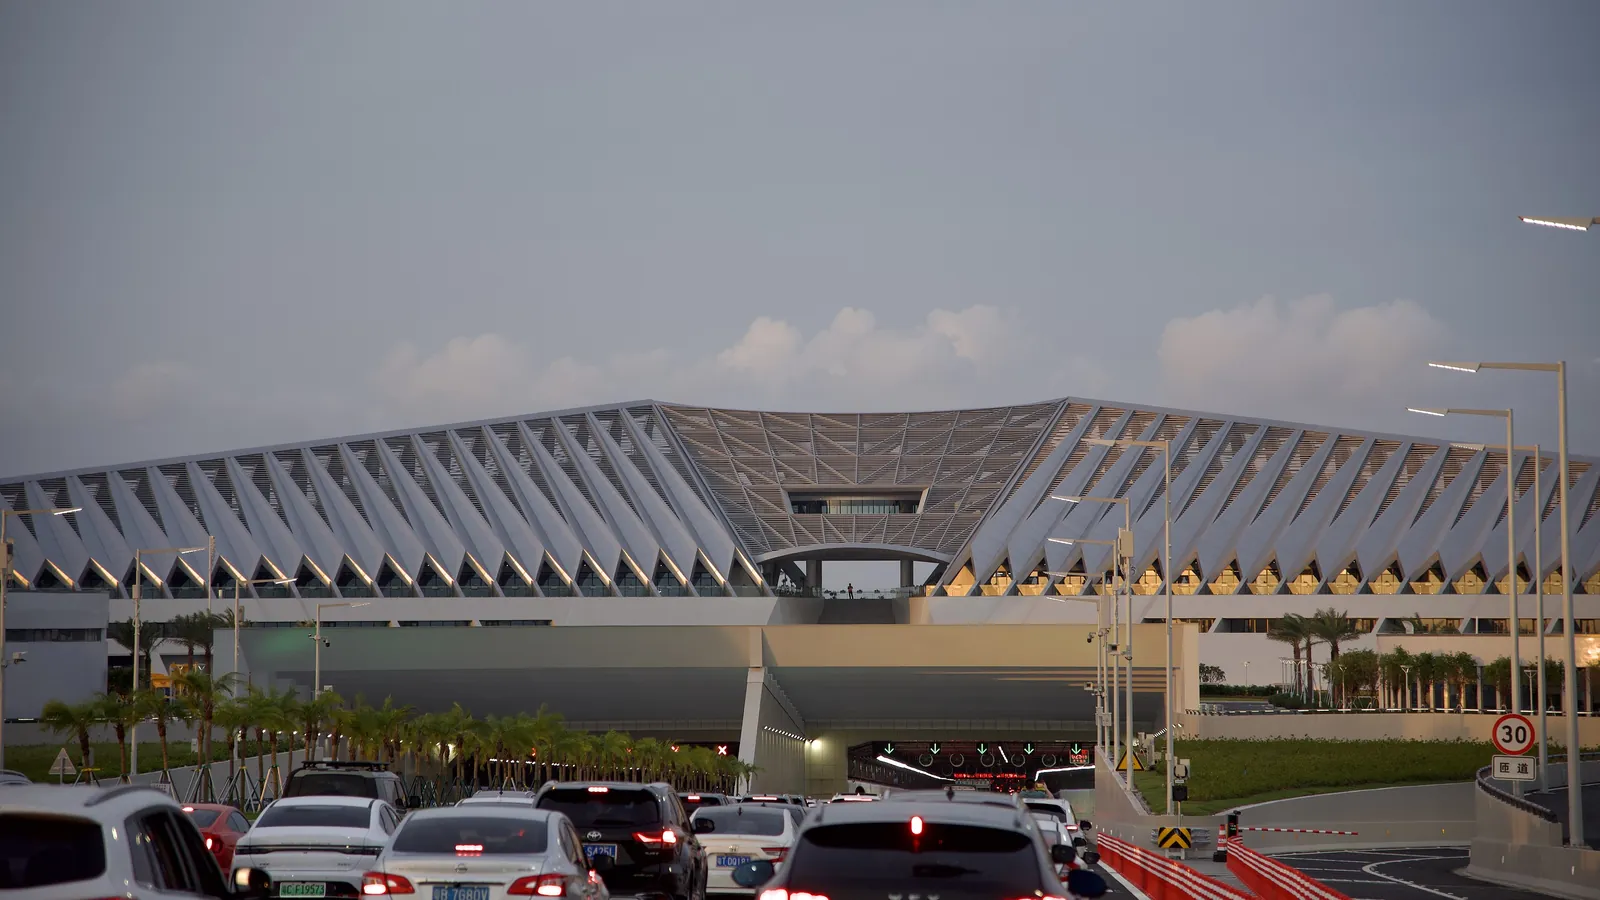
Traffic queues into the tunnel entrance of the Shenzhen Zhongshan Link in Guangdong, China; boxes mark 11 cars.
Shenzhen Zhongshan Link tunnel entrance
  • Car11

ConductVision detections on this photo. Photo: Pulsarwind, CC BY-SA 4.0, cropped.

Endpoints

What a pilot measures

Each endpoint is defined before the pilot starts, with what is counted, its unit and how the results are broken down.

What a pilot measures
PrimaryHeavy vehicle crossingsTrucks and buses detected crossing a bridge deck, counted once per vehicle per crossing.Unit:crossings per dayBy:Bridge, direction, hour
SecondaryWork-zone intrusionsVehicles detected inside a coned work area while a crew is present, counted once per vehicle.Unit:intrusions per shiftBy:Site, lane
Track trespassPeople detected on a rail bridge or track section, counted once per person per visit.Unit:people per weekBy:Site, hour
Detour shareVehicles counted on the detour as a share of vehicles counted on both routes during a closure.Unit:%By:Closure, hour

How we check the model

Each pilot measures ConductVision on your own footage against a sample checked by hand, before anyone relies on its numbers.

  • Vehicle class agreement

    Share of sampled vehicles where the ConductVision class (car, truck or bus) matches a reviewer's call.

    % · by camera, class

  • Count agreement

    Difference between the ConductVision hourly count and a reviewer's hand count of the same hour of footage.

    vehicles per hour (mean absolute difference) · by camera, light conditions

  • Intrusion recall

    Share of work-zone intrusions found by a reviewer in sampled footage that ConductVision also logged.

    % · by site

Use cases

Where teams put it to work

Bridge Condition Monitoring

Fixed cameras and periodic drone imagery can capture bridge deck surfaces, expansion joints, bearings, and substructure elements. Crack detection and spalling analysis algorithms can track deterioration progression and flag conditions that warrant engineering evaluation.

Road Surface Assessment

Vehicle-mounted and overhead cameras can detect potholes, rutting, cracking patterns, and pavement edge deterioration. Severity classifications can be geotagged and integrated with asset management databases for maintenance prioritization.

Utility Pole and Transmission Line Inspection

Drone and helicopter imagery can be analyzed for pole lean, crossarm damage, insulator degradation, and vegetation clearance violations. Priority queues can be generated for maintenance crews based on severity and proximity to population centers.

Dam and Levee Monitoring

Fixed cameras can monitor dam faces, spillways, and downstream toe areas for seepage indicators, erosion, and structural movement. Change detection between successive images can provide early warning of conditions that may require engineering intervention.

Tunnel Safety and Condition

Cameras inside tunnels can monitor lining condition, lighting function, drainage, and incident detection. Vehicle breakdowns, wrong-way entries, and smoke events can be detected and escalated to tunnel operations centers in real time.

Systems it connects to

  • Asset Management Systems (IBM Maximo, Hexagon)
  • GIS Platforms (ArcGIS, QGIS)
  • Bridge Management Systems (Pontis, AASHTO)
  • Drone Flight Management Platforms
  • SCADA Systems (Dams and Utilities)

Pilot

Scope a infrastructure pilot

Tell us about your sites and cameras, and a ConductVision engineer replies with a scoping plan built around the endpoints above.