ConductVision Enterprise

Environmental Monitoring

ConductVision watches rivers, wetlands and shorelines through fixed cameras and logs smoke plumes, waterbirds, boats and people for the teams that manage those sites.

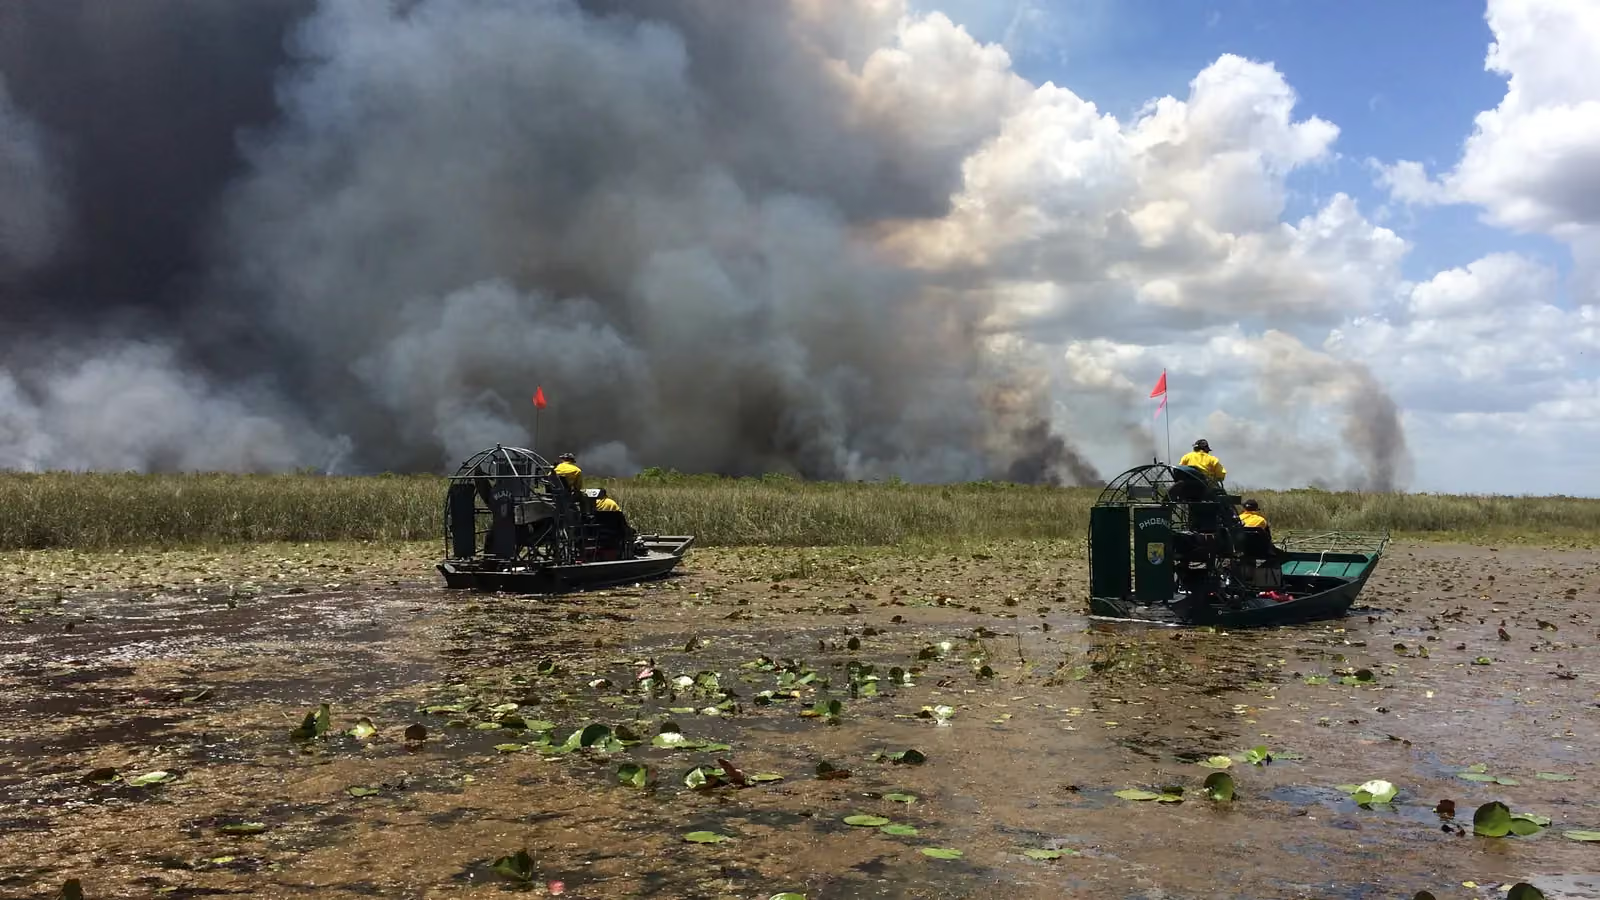
Two airboat crews patrol a lily-pad marsh at Loxahatchee National Wildlife Refuge, Florida, as smoke from a planned burn rises behind them; boxes mark two smoke plumes, both airboats and two crew members.6 detections
Loxahatchee refuge marsh
  • Smoke2
  • Boat2
  • Person2

ConductVision detections on this photo.

Environmental Monitoring is a capability unique to ConductVision, built on ConductScience's decade of experience equipping field researchers with environmental measurement tools. The system uses standard cameras, ground-mounted, tower-mounted, or drone-carried, to detect rising water levels, flood conditions, vegetation health changes, soil erosion, and air quality indicators such as visible particulate plumes. This can turn existing camera infrastructure into a continuous environmental observation network, providing early warnings that were previously only possible through expensive, dedicated sensor networks or manual site visits.

Outcomes

What your team gets

A timed record of each plume

Smoke from burns, fires and dusty haul roads drifts across a site, and no one notes when it started or stopped.

When a neighbor asks about a smoky day, the site has no timed record to check against.

How
In a pilot, ConductVision logs the first and last frame with visible smoke in each camera view.
You get
A plume log with start time, end time, camera and a still of each event.

Waterbird counts between surveys

Waterbird surveys happen on a few mornings each season, when staff can reach the site.

Counts from a few visits can miss the weeks when birds arrive, peak and leave.

How
ConductVision counts the birds in each frame from fixed cameras over ponds, mudflats and wetland edges.
You get
Daily bird counts per camera, ready to compare with water levels and restoration work across the season.

Boats and people at high water

Boats stay moored and people stay on banks and channels while the water rises.

During a flood watch, staff cannot see who is still on the water without driving out to look.

How
ConductVision detects boats, people and vehicles in channel and shoreline views and counts them in every frame.
You get
Counts of boats, people and vehicles per camera for each hour of a high-water alert.

Entries into closed areas

Seasonal closures protect nesting and resting areas, but staff cannot watch every shoreline.

Disturbance during a closure goes unrecorded, so managers cannot tell whether signs and patrols work.

How
In a pilot, ConductVision flags people and boats inside a closed area during the closure dates set for each view.
You get
An entry log for each closed area by date and hour, with a still of each entry.

What the model sees

Detections in two more settings

Coots and ducks float on a shallow pond between reed beds at Stillwater National Wildlife Refuge, Nevada; boxes mark 17 waterbirds.
Stillwater refuge pond, Nevada
  • Bird17

ConductVision detections on this photo.

Fishing boats line the banks of the Ono River flood-control channel in Ishikawa, Japan, seen from a bridge; boxes mark 13 boats and a truck.
Ono River channel, Ishikawa
  • Boat13
  • Truck1

ConductVision detections on this photo. Photo: 藤谷良秀, CC BY-SA 3.0, cropped.

Endpoints

What a pilot measures

Each endpoint is defined before the pilot starts, with what is counted, its unit and how the results are broken down.

What a pilot measures
PrimaryTime to alertMinutes from the first frame that shows a logged event, such as smoke or an entry into a closed area, to the alert reaching staff.Unit:minutes (median)By:Camera, event type
SecondaryPlume hoursHours with visible smoke or dust in view, counted from the first to the last frame of each logged plume.Unit:hours per weekBy:Camera, site
Waterbird countBirds counted in each sampled frame, reported as the daily mean and the daily peak.Unit:birdsBy:Camera, day
Closed-area entriesPeople or boats detected inside a closed area during its closure dates, counted once per entry.Unit:entries per weekBy:Area, hour
High-water activityBoats, people and vehicles detected in channel views while a high-water alert is active.Unit:detections per alert-hourBy:Camera, alert

How we check the model

Each pilot measures ConductVision on your own footage against a sample checked by hand, before anyone relies on its numbers.

  • Plume precision

    Share of smoke and dust alerts that a reviewer confirms as real plumes in a hand-checked sample of alert stills.

    % · by camera, time of day

  • Count agreement

    Difference between the ConductVision bird count and a hand count by a reviewer on a sample of frames.

    birds per frame (mean absolute difference) · by camera, flock size

  • False alerts

    Alerts a reviewer rejects, such as fog, steam or glare taken for smoke, per camera per day.

    alerts per camera-day · by camera, alert type

How it works

Environmental Monitoring in three steps

  1. Connect

    Connect Environmental Cameras

    Position cameras at riverbanks, coastlines, construction slopes, green infrastructure sites, or anywhere environmental change needs monitoring. Solar-powered enclosures with cellular uplinks enable deployment in remote locations.

  2. Analyze

    Detect Environmental Changes

    Baseline models learn the normal visual state of each camera view. Change detection algorithms identify deviations, rising water, expanding erosion, browning vegetation, or unusual particulate density, and classify them by type and severity.

  3. Act

    Alert and Report

    Threshold-based alerts notify environmental managers, emergency services, or facility operators when conditions exceed defined parameters. Time-lapse reports document changes over days, weeks, and seasons.

What it detects

Classes the models report

  • Smoke

    Visible plumes in view, with the first and last frame of each one

  • Fire

    Open flame in view, raised as an alert

  • Bird

    Each bird on water or shore, counted per frame

  • Boat

    Each boat on the water or moored along a bank

  • Person

    Each person on banks, shorelines and closed areas

  • Car and truck

    Vehicles on access roads, banks and flooded crossings

Features

What the system does

Water Level Monitoring
Tracks water levels against fixed reference markers or learned visual baselines. Detects rising levels, flood conditions, and tidal patterns without in-water sensors.
Flood Detection and Early Warning
Identifies standing water, overbank flow, and road flooding by comparing current frames against dry-condition baselines. Alerts escalate based on water extent and rate of change.
Vegetation Health Assessment
Monitors vegetation color and density changes over time using visible-spectrum analysis. Detects drought stress, die-off, invasive species encroachment, and post-fire recovery.
Erosion Detection
Identifies soil erosion, bank undercutting, and slope instability by tracking changes in ground surface contours over time. Useful for construction sites, shorelines, and hillside developments.
Visible Air Quality Indicators
Detects visible particulate plumes, dust clouds, and smoke that indicate degraded local air quality. Correlates visual observations with weather data for contextual analysis.
Time-Lapse Change Documentation
Generates annotated time-lapse sequences showing environmental changes over configurable periods. Exports support reporting requirements for environmental permits and impact assessments.
Multi-Camera Environmental Networks
Aggregate observations from camera networks across a watershed, coastline, or project area into unified dashboards. Spatial analysis reveals regional patterns from individual camera observations.

Use cases

Where teams put it to work

Flood Early Warning Systems

Municipalities need advance warning of flooding from rising rivers and storm surges. Camera-based water level monitoring can provide continuous data without maintaining expensive in-stream gauge networks.

governmentsmart city

Construction Stormwater Compliance

Construction projects must monitor erosion and stormwater runoff per environmental permits. Continuous camera monitoring can document compliance and detect erosion events between manual inspections.

constructiongovernment

Coastal Erosion Monitoring

Coastal communities and agencies track shoreline retreat and dune erosion over time. Camera-based monitoring can provide daily measurements where annual surveys previously were the only option.

governmentconservationreal estate

Agricultural Crop Monitoring

Farmers and agronomists need to detect crop stress early. Fixed cameras at field edges or drone flyovers processed by the platform can detect color changes indicating water stress, pest damage, or nutrient deficiency.

agriculture

Wetland and Habitat Restoration

Restoration projects require documentation of vegetation establishment and water regime over years. Camera monitoring can provide quantified visual records that satisfy grant reporting requirements.

conservationgovernmentresearch

Mine Site Environmental Compliance

Mining operations monitor tailings ponds, waste rock slopes, and receiving waterways for environmental changes. Automated detection can supplement manual sampling and inspection programs.

mininggovernment

Green Infrastructure Performance

Municipalities investing in rain gardens, bioswales, and green roofs need to verify they function as designed. Camera monitoring can track water retention, vegetation health, and overflow events.

smart citygovernmentconstruction

Wildlife Corridor Monitoring

The challenge

Wildlife corridors connecting fragmented habitats are critical for species survival, but their effectiveness is difficult to measure without continuous monitoring.

How ConductVision helps

ConductVision can detect and classify animals using corridor passages, logging species, count, direction, and timing. This data can help ecologists evaluate corridor utilization and advocate for infrastructure modifications that improve connectivity.

researchsmart cityinfrastructure

Species Identification

The challenge

Identifying species from camera trap images is labor-intensive, often requiring expert review of thousands of frames that are mostly empty or contain false triggers.

How ConductVision helps

The platform can filter empty frames automatically and classify detected animals by species using trained models. Researchers can receive organized datasets with species labels, dramatically reducing manual review time and enabling larger-scale studies.

researchagriculturesmart city

Livestock Behavior Monitoring

The challenge

Early signs of illness, distress, or predator encounters in livestock herds are missed when animals are spread across large pastures.

How ConductVision helps

ConductVision can monitor herd activity patterns, detecting anomalies such as isolation from the group, reduced movement, or agitation. Ranchers can receive alerts that enable earlier veterinary intervention and faster predator response.

agricultureresearch

Flood and Water Level Monitoring

The challenge

Rising water levels in rivers, retention basins, and coastal areas require continuous observation, but staffing gauge stations around the clock is impractical.

How ConductVision helps

The platform can track water levels visually using reference markers in the camera view, providing continuous level readings and rate-of-change alerts. This can supplement traditional gauge networks and provide visual confirmation during flood events.

smart cityinfrastructureresearch

Vegetation Health Assessment

The challenge

Monitoring vegetation health across large areas requires frequent field surveys that are costly and limited in spatial coverage.

How ConductVision helps

ConductVision can analyze camera feeds and drone imagery for visible indicators of plant stress such as color changes, wilting, and canopy gaps. Time-series comparisons can reveal trends that help land managers prioritize intervention areas.

agricultureresearchsmart city

Air Quality Visual Indicators

The challenge

Air quality sensor networks are sparse, and communities near industrial sites need supplementary monitoring to detect visible emissions events.

How ConductVision helps

The platform can detect visible smoke, dust, and haze events from camera feeds, providing time-stamped evidence of emission events. This visual monitoring layer can complement sensor data and support community and regulatory reporting.

smart citymanufacturingoil gas
Technical overview

Inputs, outputs and hardware

Accuracy and speed are measured on your footage and cameras during the pilot, and reported with the conditions they were measured under.

Models
Open-vocabulary detection and segmentation (YOLO family) for water, wildlife, vessels and debris
Input formats
RTSP, ONVIF, MP4, JPEG batch (trail cameras, drones), satellite imagery (GeoTIFF)
Output formats
JSON, CSV, GeoJSON, time-lapse MP4, PDF environmental reports, Webhooks
Hardware
NVIDIA Jetson at remote sites over cellular links, or any x86 with a CUDA-capable GPU

Pilot

Evaluate environmental monitoring on your footage

A pilot takes one prioritized outcome, runs on your cameras, reports the endpoints above and ends with a results review and a decision.