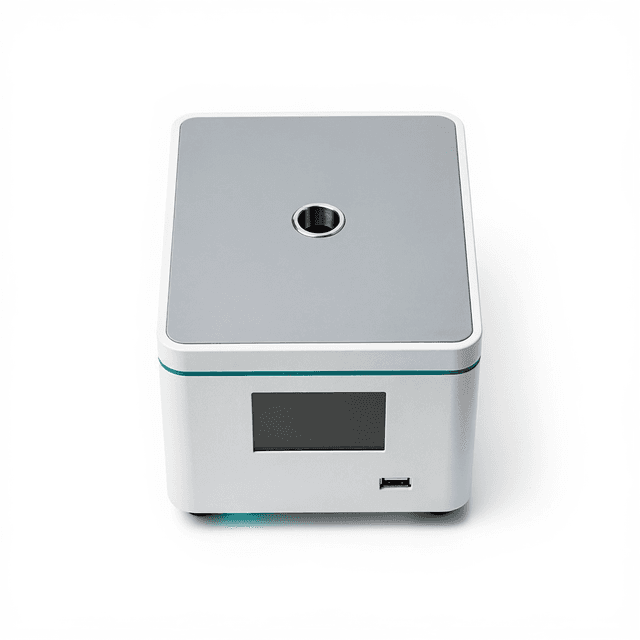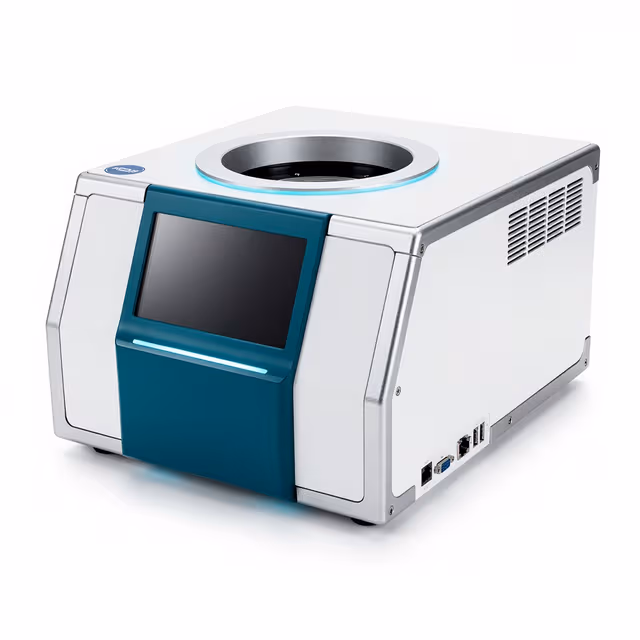
NMR Food Imaging Analyzer (40 mm)
Dual-mode NMR/MRI system operating at 0.5 T for non-destructive food analysis, combining relaxation measurements with spatial imaging in a 40 mm bore configuration.

Louise Corscadden, PhD
Director of Science · ConductScience
Ask Louise about NMR Food Imaging Analyzer (40 mm) fit, setup, configuration, or quote prep.
Already working with us? Sign in to connect this with My Scientist.
Key Specifications
Full details →- Model fit
- Configured during quote
- SKU family
- NMS-NMI20-040
- Sizing
- 80.0 x 60.0 x 80.0 cm
- Ordering
- Online checkout and quote request available
- Category
- MRI Systems
- Build notes
- Confirm accessories, station layout, and support needs before purchase
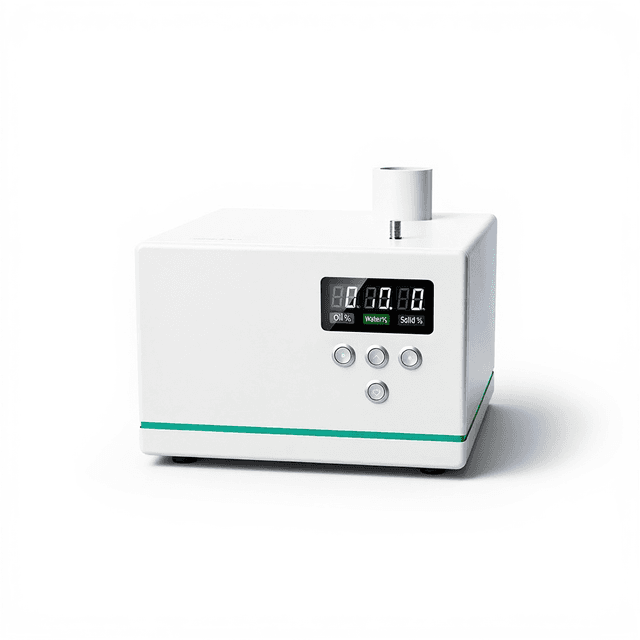
The NMR Food Imaging Analyzer (40 mm) integrates nuclear magnetic resonance relaxation analysis with magnetic resonance imaging capabilities for comprehensive food research applications. Operating at 0.5 T (20 MHz) with a rare-earth permanent magnet configuration, the system utilizes water molecules as endogenous probes to provide non-destructive, rapid assessment of food properties without chemical pretreatment or sample preparation.
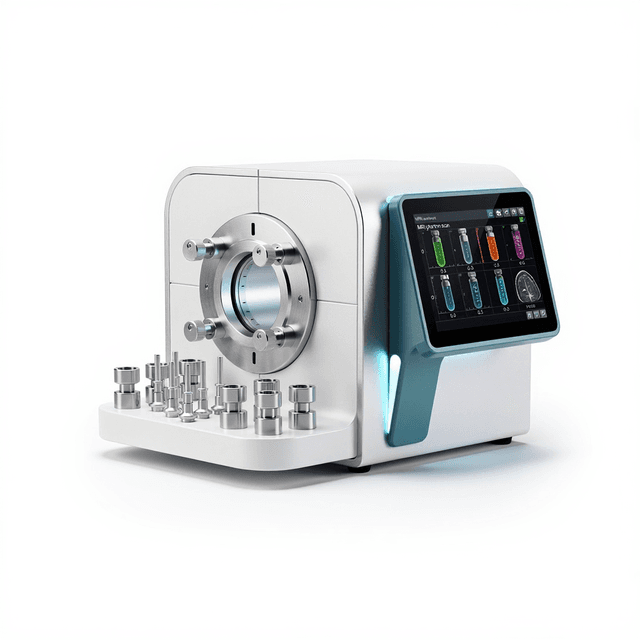
The 40 mm bore diameter accommodates a range of food samples for both qualitative and quantitative analysis. The dual-mode operation combines T1/T2 relaxation measurements with spatial imaging capabilities, enabling researchers to correlate bulk material properties with localized structural information. This approach supports food science research applications requiring both compositional analysis and spatial distribution mapping.
How It Works
Nuclear magnetic resonance relaxation analysis exploits the magnetic properties of hydrogen nuclei in water molecules naturally present in food matrices. When placed in the 0.5 T magnetic field generated by the rare-earth permanent magnet, hydrogen nuclei align with the field direction. Radiofrequency pulses at the Larmor frequency (20 MHz) tip the nuclear magnetization away from equilibrium, and the subsequent relaxation back to thermal equilibrium is monitored.
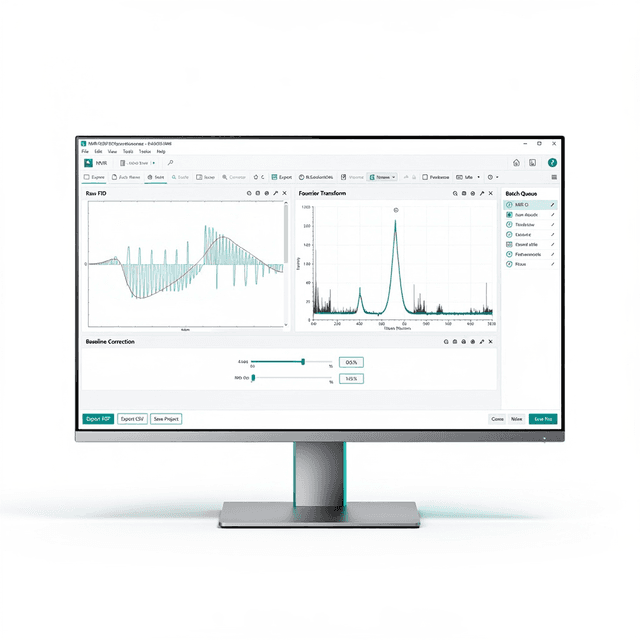
T1 (spin-lattice) relaxation reflects the rate at which nuclear magnetization returns to thermal equilibrium, providing information about molecular mobility and interactions with the local environment. T2 (spin-spin) relaxation measures the decay of transverse magnetization, indicating water binding states and microstructural constraints. Different water environments in food matrices exhibit characteristic relaxation times, enabling discrimination between free water, bound water, and water in various structural compartments.
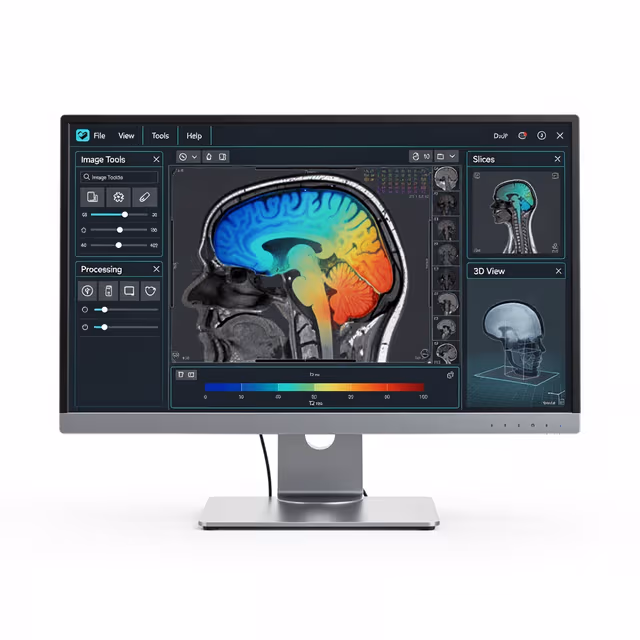
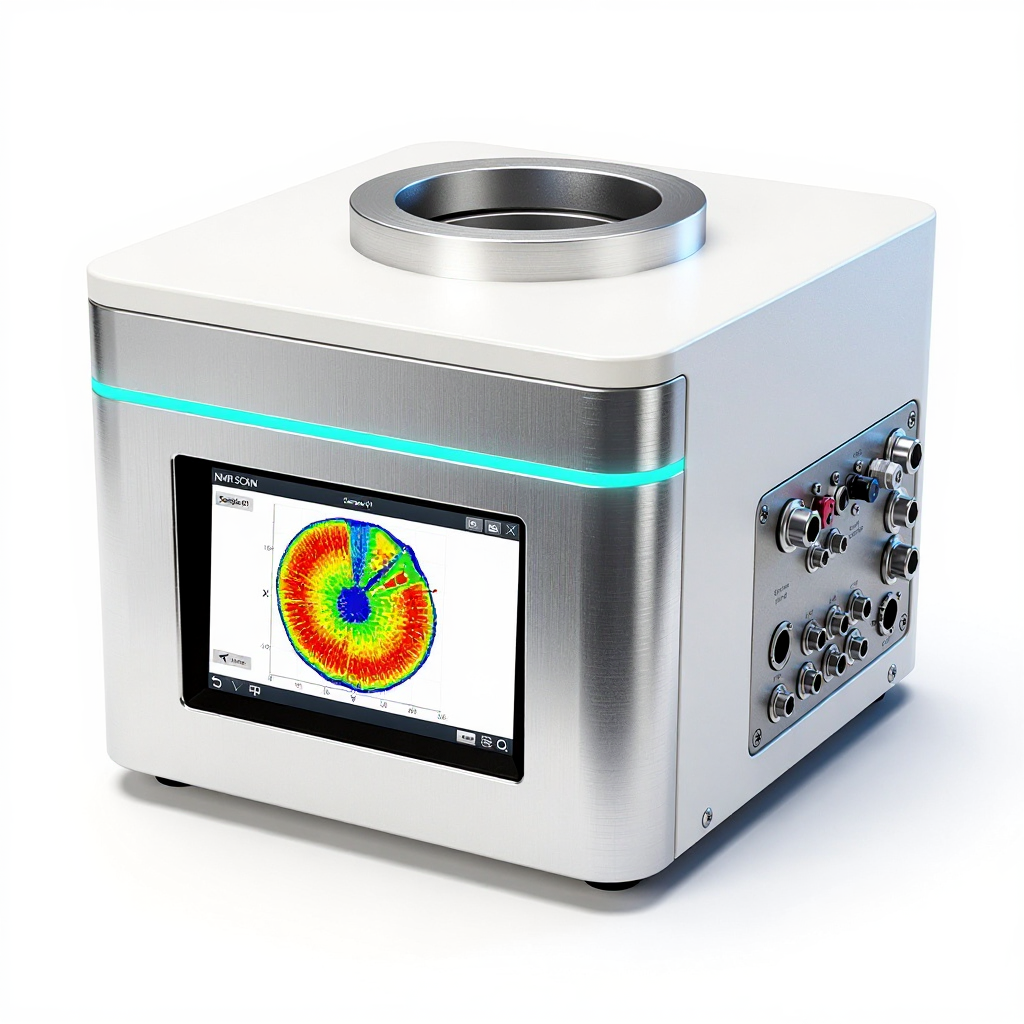
The integrated MRI imaging capability applies magnetic field gradients to spatially encode the NMR signal, generating two-dimensional images that correlate relaxation properties with spatial position. This combination allows researchers to map moisture distribution, identify structural heterogeneities, and track dynamic processes such as moisture migration during processing or storage.
Features & Benefits
Field Strength
- 0.5 T (20 MHz)
Bore Diameter
- 40 mm
Automation Level
- semi-automated
Brand
- Greenwaves Scientific
Research Domain
- Agricultural Research
- Food Science
- Materials Science
Weight
- 250.0 kg
Dimensions
- L: 80.0 mm
- W: 60.0 mm
- H: 80.0 mm
| Feature | This Product | Typical Alternative | Advantage |
|---|---|---|---|
| Magnetic Field Strength | 0.5 T permanent magnet configuration | Entry-level systems often use lower field strengths with reduced sensitivity | Provides optimal balance between measurement sensitivity and operational simplicity without cryogenic cooling requirements |
| Bore Diameter | 40 mm sample accommodation | Smaller bore systems limit sample size flexibility | Enables analysis of larger food samples and irregular geometries without sectioning or processing |
| Measurement Modes | Combined relaxation analysis and MRI imaging | Most systems offer either relaxation or imaging capabilities | Provides comprehensive characterization combining bulk properties with spatial distribution in single platform |
| Magnet Type | Rare-earth permanent magnet | Some systems require electromagnets with continuous power consumption | Eliminates ongoing operational costs and provides superior long-term field stability |
| Sample Preparation | Non-destructive analysis using endogenous water probes | Many methods require sample extraction or chemical treatment | Preserves sample integrity and enables longitudinal studies without preparation artifacts |
This system combines the measurement capabilities of dedicated relaxation analyzers with spatial imaging functionality in a permanent magnet platform. The 40 mm bore accommodates diverse food samples while the dual-mode operation provides both compositional and structural information without sample preparation requirements.
Practical Tips
Perform regular calibration using reference standards with known T1/T2 values to maintain measurement accuracy across different sample types.
Why: Temperature fluctuations and system drift can affect relaxation time measurements over time.
Keep the magnet bore clean and free of ferromagnetic debris that could distort the magnetic field homogeneity.
Why: Field inhomogeneities broaden spectral lines and degrade measurement precision.
Allow samples to reach thermal equilibrium with the magnet before measurement to ensure consistent relaxation behavior.
Why: Temperature affects molecular mobility and relaxation times, introducing variability if not controlled.
If signal-to-noise appears low, verify sample positioning within the homogeneous field region and check for air bubbles in liquid samples.
Why: Proper positioning maximizes signal detection while air bubbles create susceptibility artifacts.
Use appropriate pulse repetition times based on sample T1 values to avoid saturation effects in quantitative measurements.
Why: Insufficient relaxation delay between pulses leads to incomplete recovery and measurement errors.
Remove all ferromagnetic objects before approaching the magnet and ensure personnel with pacemakers maintain appropriate distance.
Why: Permanent magnets create strong magnetic fields that can affect medical devices and attract metallic objects.
For imaging applications, use consistent sample positioning protocols to enable comparative analysis between measurements.
Why: Spatial reproducibility is essential for quantitative imaging and longitudinal study comparisons.
Setup Guide
What’s in the Box
- NMR Food Imaging Analyzer main unit
- Power adapter and cables (typical)
- Sample positioning accessories (typical)
- Acquisition and analysis software (typical)
- User manual and technical documentation (typical)
- Calibration reference materials (typical)
- USB communication cable (typical)
Warranty
ConductScience provides a standard one-year manufacturer warranty covering parts and labor, with technical support for installation, method development, and troubleshooting assistance.
Compliance
What sample preparation is required for food analysis?
Minimal preparation is needed - samples must fit within the 40 mm bore and should be free of ferromagnetic materials. No chemical pretreatment, drying, or extraction is required as the system uses endogenous water molecules as probes.
How does the 20 MHz frequency affect measurement sensitivity compared to higher field systems?
While signal-to-noise ratio scales with field strength, 20 MHz provides sufficient sensitivity for food analysis applications. The permanent magnet configuration offers superior field stability and eliminates operational costs of superconducting systems.
Can the system differentiate between bound and free water in food matrices?
Yes, T1 and T2 relaxation measurements can distinguish different water environments based on their characteristic relaxation times, enabling quantification of water binding states and mobility.
What is the typical measurement time for relaxation analysis?
Measurement times vary with required precision and sample properties, typically ranging from minutes for rapid screening to longer acquisitions for detailed multi-exponential analysis. Consult product datasheet for specific protocols.
How does the imaging capability complement relaxation measurements?
MRI imaging provides spatial maps of relaxation properties, enabling identification of heterogeneities, defects, or moisture gradients that bulk measurements might average out.
What data formats are supported for export and analysis?
Consult product datasheet for specific file formats and data export options supported by the acquisition software.
Can the system handle samples with high fat content?
The system primarily detects hydrogen in water molecules. Fat content affects water distribution and mobility, which can be characterized through relaxation analysis, but direct fat quantification may require correlation with reference methods.
Have a question about this product?
Have a question? Just ask.
Send it over and we'll email you a personalized answer — no call, no scheduling.
Prefer to talk it through?
Accessories
Enhance your setup with compatible accessories