ConductVision Enterprise

Manufacturing

ConductVision counts people and forklifts around stations and robot cells, so plant and safety teams see how each station is staffed and where traffic mixes.

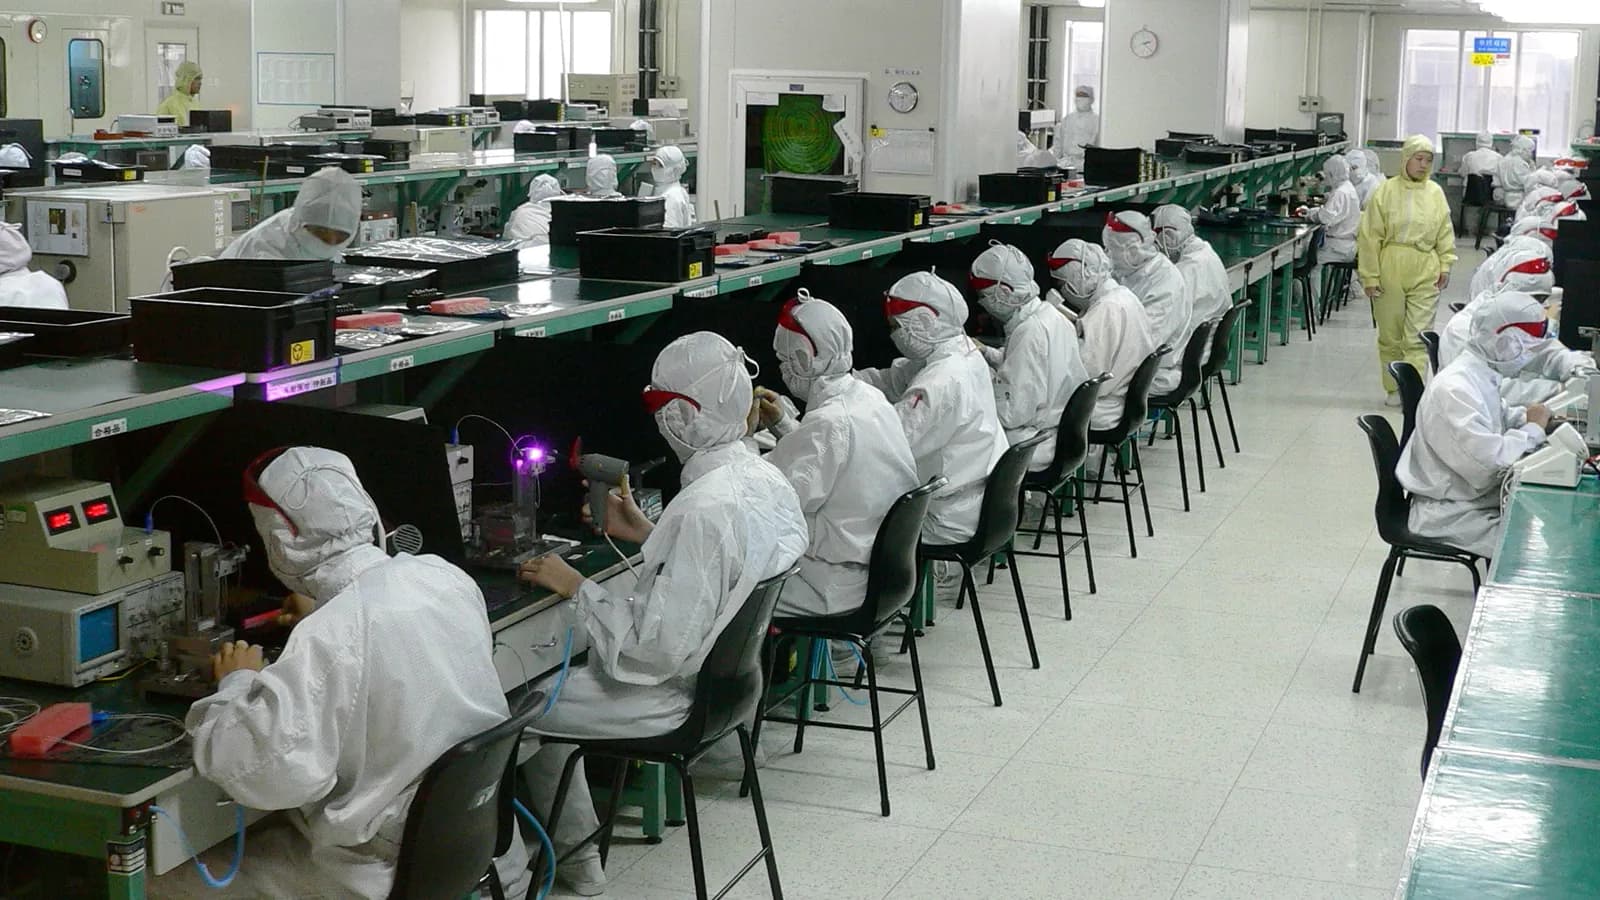
Workers in white cleanroom suits assemble components at long benches in an electronics factory in Shenzhen, China; boxes mark 20 workers.20 detections
Electronics assembly hall in Shenzhen
  • Person20

ConductVision detections on this photo. Photo: Steve Jurvetson from Menlo Park, USA, CC BY 2.0, cropped.

Manufacturing quality control has traditionally depended on statistical sampling and periodic human inspection, methods that miss intermittent defects and scale poorly on high-speed lines. Meanwhile, safety compliance monitoring relies on supervisory walkthroughs that cover only a fraction of shifts. ConductVision's technology can deploy inline visual inspection and continuous safety monitoring that operates at line speed around the clock. Defect detection, PPE verification, safety zone enforcement, and production counting can run simultaneously across multiple camera feeds, providing both quality and safety teams with unified, real-time visibility.

Outcomes

What your team gets

Crew in place at each station

One station runs short while another has spare hands, and the shift report shows only total headcount.

Output drops at the short station, and the line waits on it.

How
ConductVision counts the people at each workstation in every sampled frame.
You get
Staffed minutes per station and shift, set against the planned crew.

Restarts after breaks

Lines restart late after breaks and shift changes, and the delay hides in daily totals.

Small delays at each restart add up over a week without anyone seeing them.

How
In a pilot, ConductVision logs the first frame with the planned crew in place at each station after a break.
You get
Restart delay per station and shift, measured from the scheduled start.

Forklifts in foot zones

Forklifts cut through walkways and assembly areas to save a trip around the line.

Mixed traffic in work areas raises the chance of a collision that a rule on paper cannot stop.

How
In a pilot, ConductVision flags forklifts inside zones marked for people on foot.
You get
A log of forklift entries into foot zones by zone and hour, with a clip of each.

Visits to robot cells

Robot cells stop for faults, and an operator has to walk over to reset them.

Each wait for a reset is lost output that the cell's own log may not explain.

How
ConductVision counts the people inside each robot cell's fence and logs each visit.
You get
Visits per cell by hour, with how long each lasted, pointing to the cells that need help most often.

The challenge

Sampling-based QC catches only a fraction of defects, and those it misses become costly recalls or warranty claims downstream. Safety violations like missing PPE or restricted zone breaches often go unrecorded until an incident occurs, leaving EHS teams with incomplete data for root-cause analysis.

Our approach

ConductVision can run inline defect detection at full production speed, flagging surface flaws, dimensional anomalies, and assembly errors before parts advance to the next station. Simultaneously, PPE detection and safety zone monitoring can operate across the facility floor, generating timestamped compliance records and real-time alerts.

What the model sees

Detections in two more settings

Sewing machine operators in blue uniforms and face masks work through piles of navy fabric on a garment factory floor in Thailand; boxes mark 18 workers.
Garment factory floor in Thailand
  • Person18

ConductVision detections on this photo. Photo: Greg Walters, CC BY 2.0, cropped.

A worker in a mask and gloves sorts wood briquettes into a wire cart at a biomass fuel factory in Namibia; boxes mark two workers.
Briquette factory in Namibia
  • Person2

ConductVision detections on this photo. Photo: Tim Brunauer on behalf of Deutsche Gesellschaft für Internationale Zusammenarbeit (GIZ), CC BY-SA 4.0, cropped.

Endpoints

What a pilot measures

Each endpoint is defined before the pilot starts, with what is counted, its unit and how the results are broken down.

What a pilot measures
PrimaryStation staffing rateShare of scheduled minutes in which a station has at least its planned number of people.Unit:%By:Station, shift
SecondaryRestart delayMinutes from a scheduled start after a break or shift change to the planned crew being in place.Unit:minutes (median)By:Station, shift
Cell visitsPeople entering a robot cell's fenced area, counted once per visit with its length.Unit:visits per shiftBy:Cell, hour
Forklift zone entriesForklifts detected inside zones marked for people on foot, counted once per entry.Unit:entries per shiftBy:Zone, hour

How we check the model

Each pilot measures ConductVision on your own footage against a sample checked by hand, before anyone relies on its numbers.

  • Headcount agreement

    Difference between the ConductVision headcount at a station and a reviewer's count on sampled frames.

    people per station (mean absolute difference) · by station, camera

  • Forklift alert precision

    Share of forklift zone alerts that a reviewer confirms in a hand-checked sample of clips.

    % · by zone

  • Missed cell visits

    Share of robot-cell visits a reviewer finds in sampled footage that ConductVision did not log.

    % · by cell

Use cases

Where teams put it to work

Inline Defect Detection

High-resolution cameras positioned at critical stations can inspect every unit for surface defects, dimensional deviations, and missing components. Reject signals can be sent to diverter mechanisms automatically, helping prevent defective parts from reaching downstream processes.

PPE Compliance Monitoring

Detection models can verify hard hats, safety glasses, gloves, high-visibility vests, and hearing protection across all zones. Non-compliance events can be logged with timestamps and camera locations, providing auditable records for safety reviews.

Assembly Verification

Multi-step assembly sequences can be verified visually at each station, confirming component presence, orientation, and fastener count. Step-skip errors can be flagged before the unit leaves the station, reducing rework rates significantly.

Safety Zone Enforcement

Virtual perimeters around robotic cells, presses, and hazardous material areas can trigger alerts when unauthorized personnel or unprotected workers enter. Zone breach events can be recorded and escalated according to configurable severity tiers.

Production Counting and OEE

Cameras can count units at entry and exit points of each production cell, calculating throughput, reject rates, and cycle times automatically. Data can feed Overall Equipment Effectiveness dashboards without requiring sensor retrofits on legacy machines.

Occupancy Management

The challenge

Building managers lack accurate, real-time occupancy data, making it difficult to manage capacity limits and allocate resources across floors and zones.

How ConductVision helps

ConductVision can count people entering and exiting each zone, maintaining a live occupancy figure at all times. Dashboards can display current counts against capacity thresholds, and alerts can fire when zones approach or exceed limits, enabling proactive crowd control.

retailhealthcaresmart city

Queue Optimization

The challenge

Long queues frustrate customers and reduce throughput, yet managers often lack visibility into wait times until complaints arrive.

How ConductVision helps

The platform can measure queue length and estimated wait time at service points in real time. When thresholds are exceeded, alerts can prompt managers to open additional lanes or redirect traffic, improving customer satisfaction and operational throughput.

retailhealthcarelogistics

Throughput Counting

The challenge

Accurate counting of items, pallets, or vehicles passing through a checkpoint is critical for inventory and logistics but error-prone when done manually.

How ConductVision helps

ConductVision can count objects passing through defined zones with high accuracy, logging timestamps and classifications. This data can feed into inventory systems and operational dashboards, enabling real-time tracking of throughput against targets.

logisticsmanufacturingretail

Asset Tracking

The challenge

High-value equipment and mobile assets are frequently misplaced or underutilized because manual tracking systems are labor-intensive and outdated.

How ConductVision helps

The platform can detect and track tagged assets as they move through camera views, maintaining a log of last-known locations. Geofence alerts can notify teams when equipment leaves designated areas, reducing loss and improving asset utilization rates.

logisticsconstructionmanufacturing

Space Utilization Analysis

The challenge

Organizations pay for space they do not fully use, but lack granular data on how meeting rooms, desks, and common areas are actually occupied.

How ConductVision helps

ConductVision can measure utilization rates for defined zones throughout the day, generating heatmaps and time-series reports. Facilities teams can use this data to right-size office layouts, consolidate underused spaces, and justify real-estate decisions with hard evidence.

smart cityretailhealthcare

Energy Monitoring Correlation

The challenge

Energy costs rise when HVAC and lighting run at full capacity in empty or lightly occupied areas, and occupancy sensors cover only a fraction of the floor plan.

How ConductVision helps

The platform can provide zone-level occupancy data that integrates with building management systems. HVAC and lighting adjustments can be triggered based on actual presence rather than schedules, reducing energy waste in unoccupied areas.

smart citymanufacturingretail

Process Bottleneck Detection

The challenge

Production lines stall when upstream or downstream stations fall behind, and supervisors may not identify the constraint until output drops significantly.

How ConductVision helps

ConductVision can monitor activity levels at each workstation, detecting idle periods and accumulation of work-in-progress. Bottleneck alerts can direct supervisors to the constraint in real time, and trend data can reveal recurring patterns that inform process redesign.

manufacturinglogisticsconstruction
Systems it connects to

  • MES (Manufacturing Execution Systems)
  • SCADA / PLC Networks
  • ERP Systems (SAP, Oracle, Epicor)
  • Quality Management Systems (QMS)
  • OEE Dashboards

Pilot

Scope a manufacturing pilot

Tell us about your sites and cameras, and a ConductVision engineer replies with a scoping plan built around the endpoints above.