ConductVision Enterprise

Gauge & Meter Reading

ConductVision finds the gauges in each camera view and, once each face is calibrated, reads the needle into a timed value for plant and utility teams.

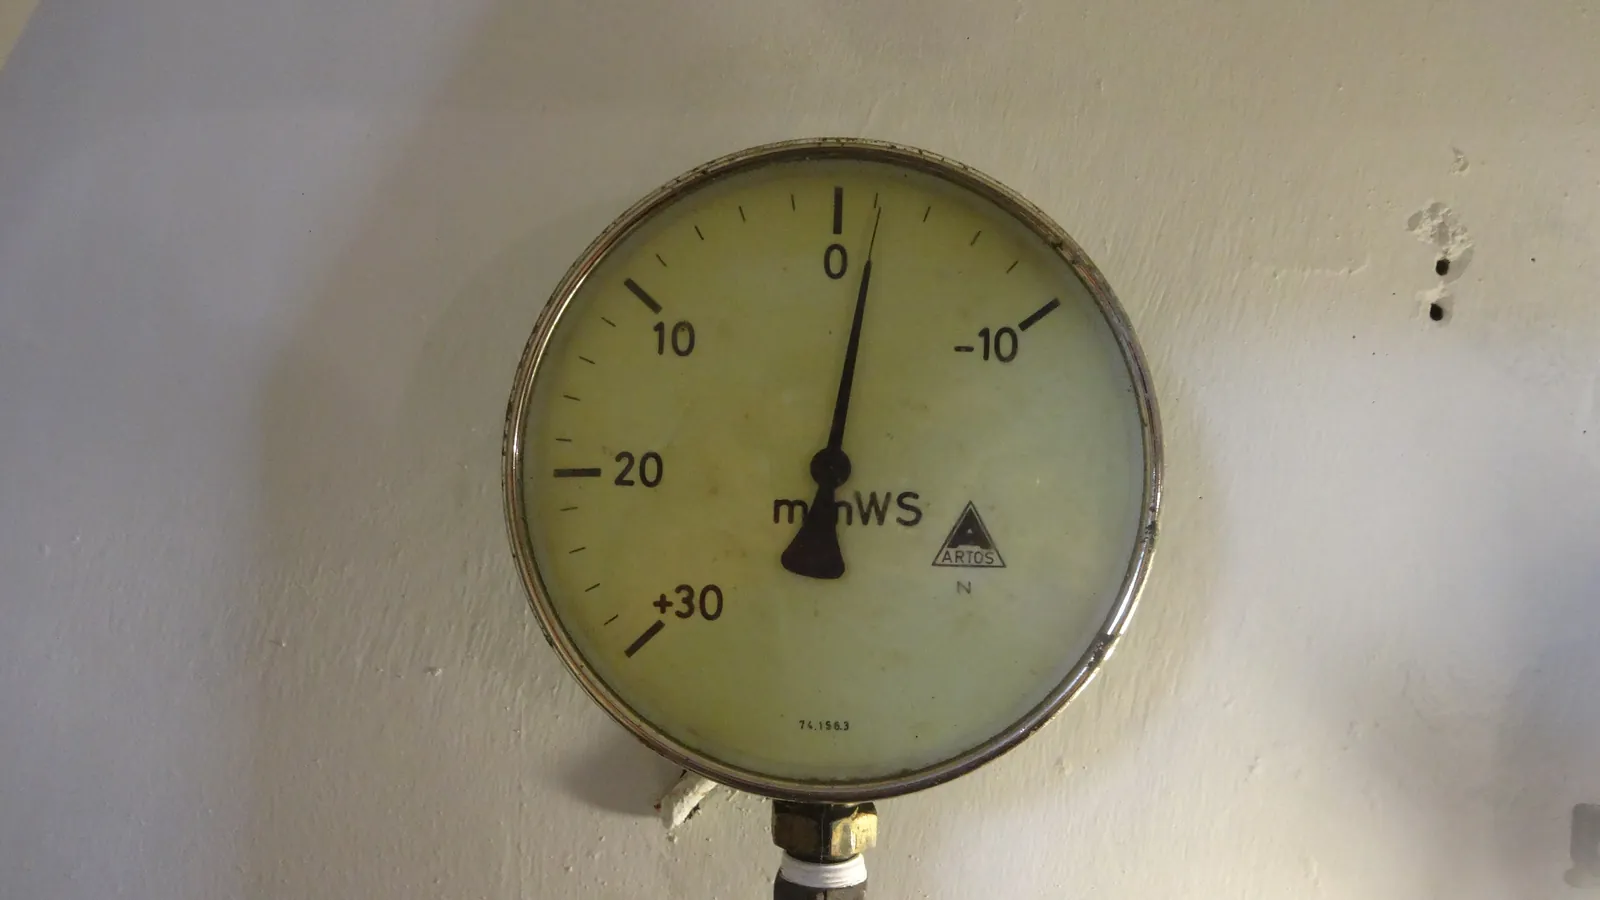
A ventilation pressure gauge on a shelter wall, its needle resting near zero; one box marks the gauge.1 detection
Ventilation gauge in a Rotterdam shelter
  • Gauge1

ConductVision detections on this photo. Photo: AgainErick, CC BY-SA 4.0, cropped.

Gauge & Meter Reading converts the visual output of analog gauges, mechanical meters, and numeric displays into structured digital data using camera-based inference. The system is designed to read pressure gauges, temperature dials, flow meters, level indicators, and seven-segment displays, bridging the gap between legacy instrumentation and modern monitoring platforms without rewiring or replacing existing equipment. A single camera can monitor multiple gauges within its field of view, and the platform supports scheduled reading intervals or continuous monitoring depending on the application.

Outcomes

What your team gets

Round sheets checked against the gauge

Operators copy gauge values onto a round sheet, and a misread or skipped gauge looks like any other entry.

A wrong value in the log can hide a slow drift or start a false alarm.

How
In a pilot, ConductVision reads each calibrated gauge at the time of the round and sets its value beside the written one.
You get
A list of round entries that disagree with the camera reading, with the gauge image.

A gauge list for every camera

Before any gauge can be read, someone has to list which gauges each camera can see.

Building that list by walking the plant and taking photos can take days.

How
ConductVision finds each gauge face in a camera view and boxes it, ready for calibration.
You get
A gauge inventory per camera, with a crop of each face for setup.

Unreadable gauges flagged

Fogged glass, glare and a blocked view make some gauges hard to read from a camera.

A camera that keeps sending values from an unreadable face sends bad data.

How
In a pilot, ConductVision marks a reading as unreadable when it cannot find the needle or the scale.
You get
A daily list of gauges that need cleaning, a new angle or a closer camera.

A picture behind every value

A value in the historian that looks wrong is hard to trust without seeing the gauge.

Staff drive out to check a gauge that a photo could have confirmed.

How
In a pilot, each reading keeps the crop of the gauge face it came from.
You get
Readings a technician can confirm from the office by opening the image.

What the model sees

Detections in two more settings

A pressure gauge for a railway air supply pipe sits behind a clear cover above its nameplate; one box marks the gauge.
Air supply gauge on a train
  • Gauge1

ConductVision detections on this photo.

A 1933 pressure gauge on museum display, its case opened to show the inner workings beside its removed dial; boxes mark the open gauge and the dial.
Antique gauge at a science museum
  • Gauge2

ConductVision detections on this photo.

Endpoints

What a pilot measures

Each endpoint is defined before the pilot starts, with what is counted, its unit and how the results are broken down.

What a pilot measures
PrimaryReading coverageShare of scheduled readings for which ConductVision returns a value from a readable gauge face.Unit:%By:Gauge, camera, hour
SecondaryLog disagreementsRound-sheet entries that differ from the camera reading by more than the gauge's smallest scale division.Unit:entries per weekBy:Round, gauge
Unreadable gaugesGauges with no readable value for a whole day, counted each day.Unit:gauges per dayBy:Camera, cause
Out-of-band timeMinutes a reading stays outside the warning band set for that gauge.Unit:minutes per dayBy:Gauge

How we check the model

Each pilot measures ConductVision on your own footage against a sample checked by hand, before anyone relies on its numbers.

  • Reading error

    Difference between the ConductVision reading and a reviewer's reading of the same gauge image, in scale divisions.

    scale divisions (median absolute difference) · by gauge type, camera angle

  • Gauges found

    Share of gauges a reviewer marks in sampled frames that ConductVision boxed.

    % · by camera

  • Unreadable agreement

    Share of readings marked unreadable that a reviewer agrees could not be read from the image.

    % · by cause

How it works

Gauge & Meter Reading in three steps

  1. Connect

    Point Cameras at Gauge Panels

    Mount cameras facing gauge clusters, meter panels, or individual instruments. The calibration interface lets you outline each gauge face, mark the scale range, and define units. A single camera can monitor up to a dozen gauges in one view depending on resolution.

  2. Analyze

    Read and Interpret Values

    The system detects the gauge face, locates the needle or indicator, and maps its angular position to the calibrated scale to produce a numeric reading. For digital displays, an OCR model reads the displayed digits. Readings are validated against configurable min/max ranges to flag impossible values.

  3. Act

    Stream Data and Alert on Thresholds

    Readings are published to SCADA, historian, or IoT platforms at configurable intervals. When a gauge reading crosses a warning or critical threshold, the system sends alerts to operations teams with the reading value, gauge location, and a snapshot of the gauge face.

What it detects

Classes the models report

  • Pressure gauge

    Each round gauge face in view, boxed and cropped

  • Needle

    The needle angle on each calibrated gauge, turned into a value on its scale

  • Reading

    The value and unit for each gauge at each scheduled time

  • Unreadable face

    Glare, fog or a blocked view, logged in place of a value

Features

What the system does

Analog Gauge Reading
Reads circular and semicircular analog gauges by detecting the needle angle relative to the calibrated scale. Supports pressure gauges, temperature dials, ampmeters, voltmeters, and flow indicators.
Digital Display OCR
Reads seven-segment LED displays, LCD panels, and mechanical counter wheels. Handles varying digit sizes, segment colors, and display orientations.
Level Indicator Reading
Reads sight glasses, tube-type level indicators, and graduated tank markings by detecting the liquid meniscus or float position against the calibrated scale.
Multi-Gauge Panel Monitoring
Monitors an entire gauge panel from a single camera, reading each gauge independently. Useful for boiler rooms, compressor stations, and process control panels with dozens of instruments.
Threshold Alerting
Configure warning and critical thresholds for each gauge. Alerts fire when readings enter abnormal ranges, enabling early intervention before equipment failure or process deviation.
Historical Trend Logging
Stores every reading with a timestamp, building a time-series history for each gauge. Trend analysis reveals equipment degradation, seasonal patterns, and correlation between instruments.
SCADA and Historian Integration
Publishes readings via OPC UA, Modbus TCP, or MQTT to integrate with existing SCADA systems and process historians. Bridging analog instruments to digital infrastructure without replacing hardware.
Use cases

Where teams put it to work

Legacy Industrial Equipment Monitoring

Older plants contain thousands of analog gauges that would cost millions to replace with digital transmitters. Camera-based reading can digitize these instruments for pennies per gauge, integrating them into modern monitoring dashboards without any physical modification.

manufacturingenergychemical

Boiler Room and Utility Monitoring

Building boiler rooms, chiller plants, and pump stations contain gauge clusters that are checked manually on rounds. Automated reading can provide continuous monitoring between rounds and alert immediately when a reading drifts out of range.

utilitiesreal estatecorporate

Oil and Gas Wellhead Monitoring

Remote wellheads often have analog pressure and temperature gauges with no digital output. A ruggedized camera with cellular backhaul can transmit readings to central operations, reducing the need for technician site visits to remote locations.

energy

Water and Wastewater Flow Monitoring

Municipal water systems include mechanical flow meters at pump stations and treatment plants. Camera-based reading can add digital monitoring to these meters without interrupting service for meter replacement.

utilitiesgovernment

Substation and Electrical Panel Monitoring

Electrical substations and panels contain analog ammeters, voltmeters, and power factor gauges. Continuous camera-based monitoring can detect abnormal readings and log power quality data without installing additional current transformers.

energyutilities

Laboratory Instrument Digitization

Research laboratories use analog instruments, vacuum gauges, pressure regulators, rotameters, that produce no digital output. Camera-based reading can log instrument values automatically during experiments, reducing manual recording errors.

researchpharma

Technical overview

Inputs, outputs and hardware

Accuracy and speed are measured on your footage and cameras during the pilot, and reported with the conditions they were measured under.

Models
Open-vocabulary gauge detector (YOLO family), with needle reading calibrated for each gauge in a pilot
Input formats
RTSP, ONVIF, MP4, JPEG snapshots (scheduled capture), USB cameras
Output formats
JSON, MQTT, OPC UA, Modbus TCP, CSV, Prometheus metrics
Hardware
NVIDIA Jetson, Raspberry Pi 4/5 (for low-gauge-count deployments), industrial PCs

Pilot

Evaluate gauge & meter reading on your footage

A pilot takes one prioritized outcome, runs on your cameras, reports the endpoints above and ends with a results review and a decision.