

Standardize
Protocol Builder
Save fixed analysis workflows every team member runs identically. Lock parameters, prevent drift, and standardize methods across multi-site studies.
Automated cell counting, colony counting, particle sizing, and image quantification — no coding required. ConductVision Image replaces manual workflows with AI segmentation, locked protocols, and publication-ready exports that work with any microscope.

Core capabilities
Five capabilities that replace scattered manual workflows with one standardized, auditable platform.
Standardize
Save fixed analysis workflows every team member runs identically. Lock parameters, prevent drift, and standardize methods across multi-site studies.
Detect
Automatic cell and feature identification without manual thresholding. Visual overlays show exactly what was detected, and why.
Defend
Complete transparency on every setting and adjustment. Reviewers see the exact pipeline that produced your data.
Scale
Apply your locked protocol to thousands of images at once. High-throughput analysis without manual intervention or crashes.
Report
Export annotated images, summary data, and a methods paragraph together. Publication-ready figures and tables in a single click.
See it in action
Watch ConductVision detect, segment, and track cells across a live imaging sequence — no thresholding by hand, no scripting.
Featured application
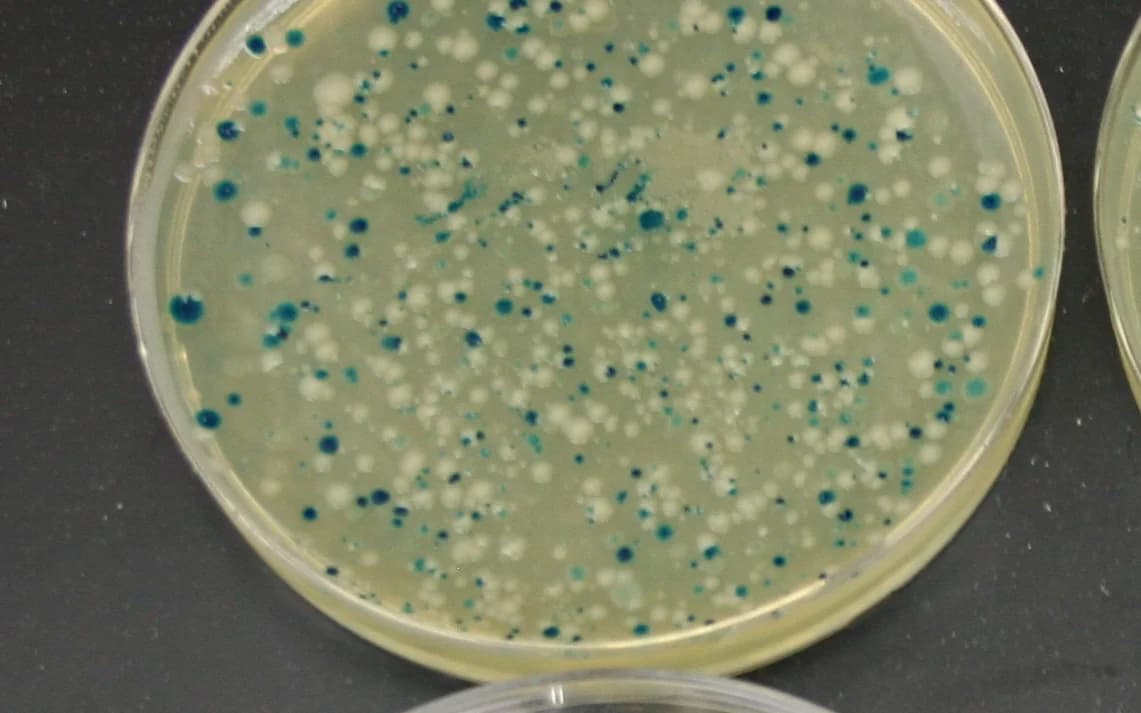
A dedicated colony-counting workflow for agar plates: upload a plate image or image folder, set plate-aware gates, and export counts with colony locations, overlays, and distribution analysis. It is software for existing image files, not a separate device.
Typical workflow
Use one agar plate image when you only need the final colony count or a count at a specific time point.
Time points
Analyze images collected at scheduled time points for growth curves without changing the counting workflow.
Batch mode
Apply the same locked colony-detection settings across plate folders, dilution series, or repeated experiments.
AI output
Export colony segmentation, total counts, colony coordinates, and spatial distribution summaries for one image or a folder.
25 built-in analysis workflows spanning life sciences and materials science, with full support for custom protocols.
 Life Science
Slide QC, H&E nuclei, DAB quantification, morphology, and instrument workflow handoffs
 Life Science
Count the spots inside every nucleus.
 Life Science
Track the nucleus when the cytoplasm is invisible.
 Life Science
Follow mitochondria and lysosomes through the cell.
 Engine
Three ways to count. The right one depends on your cells.
 Engine
Tell the engine your optics; it selects the model.
 Life Science
Precise cell counting using fluorescent markers
 Life Science
Measure culture confluence from phase-contrast images
Life ScienceFluorescence-based nuclei detection and quantification
 Life Science
Detect nuclei in H&E histology sections
Life ScienceQuantify DAB staining intensity in IHC samples
 Life Science
Cell viability counting from live/dead fluorescence images
 Life Science
Count cells, bacteria, and particles in any image
Life ScienceAI colony counts from uploaded agar plate images
 Life Science
Coverage and area percentage calculations
 Materials Science
Image-based particle size distribution
 Materials Science
Standardized grain size per ASTM E112
 Materials Science
Measure area fractions of phases and structures
 Materials Science
Automated defect identification and counting
 Materials Science
Assess thickness and uniformity of coatings
 Materials Science
Measure coating layers, black-area porosity, and Vickers indentation dimensions
 Materials Science
Quantify porosity and surface coverage
 Materials Science
Measure fiber length, orientation, and density
 Materials Science
Build repeatable routines for your own criteria
 Medical Device & Pharma QC
Count, diameter & size distribution for drug-delivery and calibration microspheres
Prefer to browse by field?
Validated Performance
Tested against expert manual counting — the gold standard in cell biology.
Combined precision and detection rate vs. expert counts
Virtually no false detections
Finds the vast majority of real cells

99% precision means nearly every detected cell is real. No phantom counts inflating your data or triggering unnecessary review cycles.
93% detection rate across diverse cell types. The model finds cells that manual counting overlooks, especially in dense or overlapping regions.
Same algorithm, same parameters, every time. Eliminate inter-operator variability and produce counts that hold up across reviewers and publications.
| IoU Threshold | True Pos. | False Pos. | False Neg. | Precision | Recall | F1 Score |
|---|---|---|---|---|---|---|
| 0.3 (lenient) | 21,940 | 129 | 1,675 | 99.4% | 92.9% | 96.1% |
| 0.5 (standard) | 21,891 | 178 | 1,724 | 99.2% | 92.7% | 95.8% |
| 0.7 (strict) | 21,593 | 476 | 2,022 | 97.8% | 91.4% | 94.5% |
| 0.9 (very strict) | 17,652 | 4,417 | 5,963 | 80.0% | 74.7% | 77.3% |
Live-Cell Tracking
Point ConductVision Image at a time-lapse video and it follows each cell frame by frame — reconstructing how cells move, divide, and disappear. You get trajectories, full lineage trees, and population dynamics, not just a single-frame count.
Cell trajectories
Division / lineage tree
Motion
Lineage
Temporal
Population
Morphology
Every segmented cell, nucleus, particle, or grain is measured for its full morphology in the same pass that counts it. Results report in pixels and convert to microns the moment you set a scale.
Used across cell biology, pathology, microbiology, materials science, and neuroscience — wherever object shape and texture carry the signal.
Core measurements
Advanced descriptors
Particle & Microsphere Sizing
Microsphere and particle protocols return the distribution statistics that QC and formulation teams actually report — percentiles, spread, and a fitted normal curve over the diameter histogram.
Scientific rigor
The engine and controls behind every count, measurement, and distribution.
Every pixel gets a cell-probability and a flow vector toward its cell center, so touching and overlapping objects separate cleanly — no manual thresholding.
Match the model to your image. Choose the microscopy, plate, or microsphere image type and the system routes to the AI model tuned for it.
Adjust max flow, minimum cell probability, or minimum size and re-run the count on the spot — tune to your ground truth without reprocessing from scratch.
Define the pixel-to-micron ratio once and every measurement — area, diameter, Feret, distances — converts to real-world units automatically.
Compare the segmentation overlay against the original image side by side at matched zoom and pan, so you verify every detection before it reaches your data.
Microscope-agnostic denoising and normalization, plus neurite probability maps and multi-scale handling for thin structures like axons, run before segmentation.
How It Works
Step 01
Set segmentation parameters, thresholds, and measurement rules. Lock the protocol so every analyst runs the identical pipeline.

Step 02
Automated segmentation identifies cells, particles, defects, or regions of interest. Visual overlays let you confirm what was found.

Step 03
Apply your locked protocol to entire image sets in one click. Process overnight runs, multi-well plates, or time-lapse series without touching a single parameter.

Step 04
Annotated images, summary statistics, and method descriptions export together. Drop directly into your manuscript, or pipe CSVs into R, Python, or Prism.

If you're spending hours writing macros, fighting plugin conflicts, or getting inconsistent results across observers — ConductVision eliminates all of that.
How it compares
How ConductVision Image stacks up against the free and commercial microscopy tools most labs already run.
| Feature | RecommendedConductVision Image | ImageJ / Fiji | Image-Pro (MediaCybernetics) |
|---|---|---|---|
| AI segmentation | Built-in | Plugin required | (v11+) |
| Coding required | No | Yes (macros / scripts) | No |
| Works with any microscope | |||
| Batch processing | 5,000+ images | Manual scripting | |
| ASTM E112 compliance | Built-in | ||
| Locked protocols | Version-controlled | No locking | Partial |
| Audit trail | Full | Partial | |
| Commercial support | Dedicated team | Community only | |
| Pricing | Request quote | Free / open source | ~$2K–$5.5K/year |
Reproducibility
Define your method once. Lock it forever. Ensure every researcher measures with the exact same ruler, regardless of who runs the experiment.
Create locked standards for everyday tasks
All plans include 5 seats, unlimited analysis, and automatic updates. No per-image fees.
5 seats included
$3,990 total · Save 60%
On-premise deployment, unlimited users, LIMS integration, and a dedicated account manager.
Deployment
Both options use the same interface and produce identical, standardized outputs.
Browser-based access with automatic updates. No IT setup required — your team is analyzing images in minutes.
Local server or private cloud for institutions with strict data residency or air-gap requirements.
Request a demo and see ConductVision Image running on your own images within the week.