ConductVision Gait Analysis and Tracking Metrics
ConductVision redefines accuracy in gait measurement using advanced Artificial Intelligence and Machine Learning technologies.
Unsupervised Hidden Markov Model (HMM)
We utilize an unsupervised Hidden Markov Model (HMM), a powerful probabilistic model, to automatically classify the two crucial states of paw movement: stance and swing.
This process allows for smooth temporal segmentation of paw activity.
It provides a data-driven, label-free approach to accurately identify individual stride cycles.
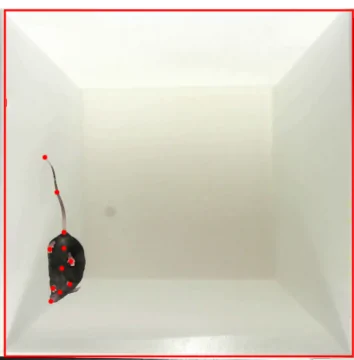
Key Point Tracking
ConductVision automatically tracks key body points, including the nose, forepaws, hind paws, and body center. It uses these tracking points to calculate spatial distance and paw movement, which are then fed into the HMM to calculate precise gait parameters, delivering insights into motor function, neurological disorders, and recovery.
What We Measure
Gait analysis offers a powerful, non-invasive method for evaluating locomotor function in mice. ConductVision’s advanced tracking and analysis software quantifies a wide array of metrics, providing researchers with high-precision tools to assess motor health, neurological recovery, and experimental outcomes.
Key Gait Metrics Measured by ConductVision
- Paw Details
- Stride Details
- Gait Coordination
- Body Details
- Tail Details
1. Paw Details
The Paw Details feature provides granular, phase-specific metrics for each individual paw, which is crucial for detailed gait phenotyping. For every stance (paw on ground) and swing (paw in air) phase, the software calculates three key metrics: Duration, Distance Traveled, and Base of Support (BoS)..
Metrics Considered:
| Parameter | Description | |
|---|---|---|
|
Duration |
Duration is quantified both in frames and milliseconds (DurMs), giving you the exact time spent in each state (swing or stance) |
|
|
Distance Travelled |
Distance Traveled is reported in both pixels and centimeters (Travel Pixel/Cm), which is critical for assessing how far the paw moves horizontally during the swing phase, or if the paw slides during the stance phase |
|
|
Base of Support (BoS) |
Calculated as the average distance between the center of the paw being analyzed and the center of its opposite-side counterpart (e.g., LeftForePaw BoS is the average distance to the RightForePaw center) over the phase’s duration. |
|
|
State |
Whether the subject is in stance or swing state of locomotion in the frame |
|
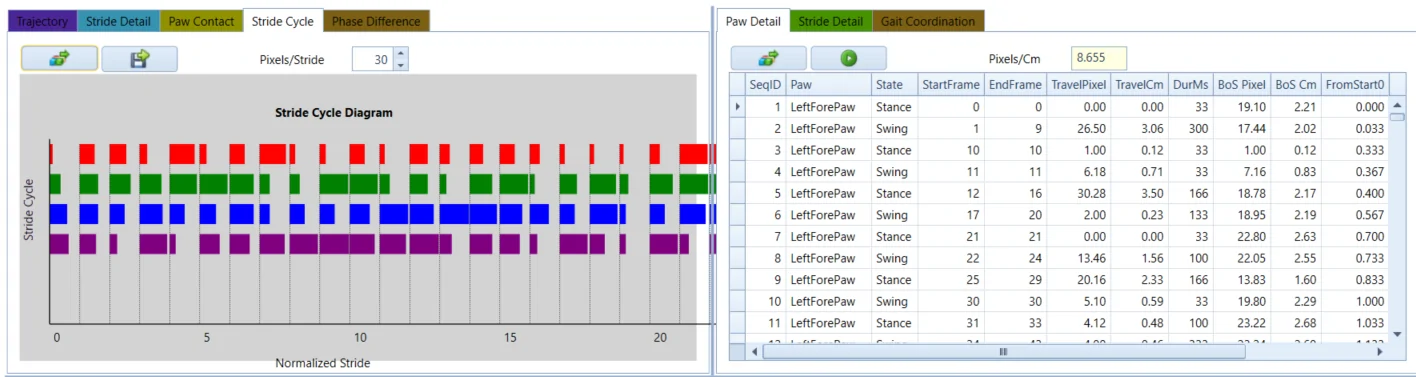
The Stride Cycle Diagram shows the complete movement pattern of a limb (paw) from one contact with the ground to the next contact of the same limb.
- A stride cycle duration = stance duration + swing duration
- X-axis represents the normalized stride interval
- Each bar represents the portion of time a paw in stance
- Data are from Paw Contact in the right-side panel
- The parameter Pixels/Stride shows the drawing width per stride. For example, 30 pixels/stride draws a stride interval with 30 pixels. The parameter can be adjusted to make stride interval drawing larger or smaller
- The chart can be exported to a high-resolution image
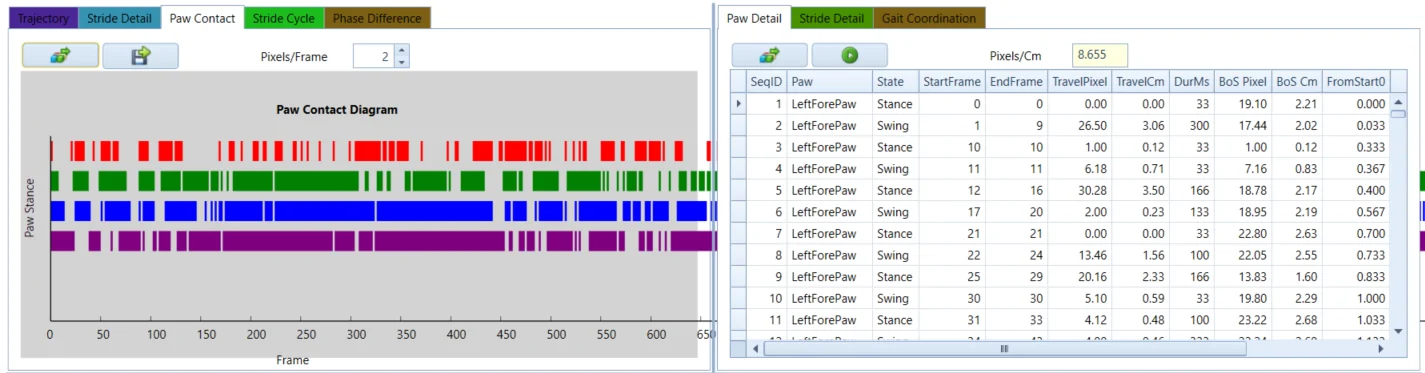
The Paw Contact Chart displays paw’s stance vs swing duration in frames. X-axis represents the frame.
- The four bar charts represent the four paws
- LeftForePaw – Red color in the first row
- RightForePaw – Green color in the second row
- LeftHindPaw – Blue color in the third row
- RightHindPaw – Purple color in the last row
- Color bars represents the stance and the gap represents the swing
- The parameter Pixels / Frame is the drawing width on the canvas for visual purposes
- The chart can be exported to a high-resolution image
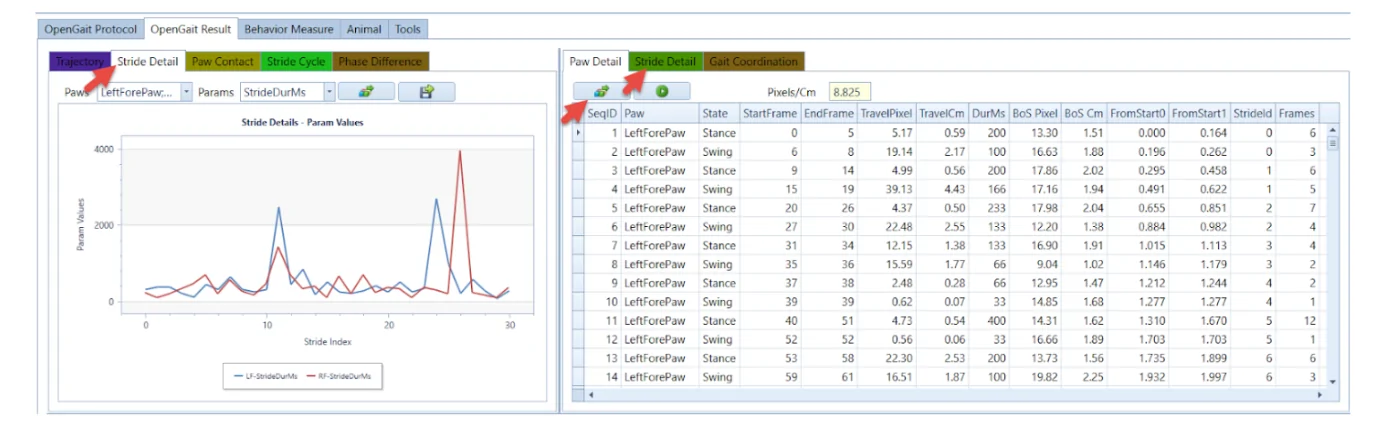
2. Stride Detail
The Stride Detail Chart provides a focused, longitudinal view of key gait parameters, allowing researchers to track the performance of individual strides over the duration of a trial.
| Parameter | Description | |
|---|---|---|
|
PawName |
Which paw is in stride at which frame |
|
|
Stride Length |
In centimeters and pixels |
|
|
Stride Duration |
Per paw in milliseconds |
|
|
Duty Cycle |
The ratio of Stance Duration to Stride Duration (often expressed as a percentage). |
|
|
Base of Support (BoS) |
The average distance between the paw center and the center of the corresponding paw on the opposite side (e.g., LeftForePaw BoS uses the average distance between LeftForePaw and RightForePaw). |
|
The Stride Cycle Chart displays a normalized stride cycle diagram. A stride cycle is the complete movement pattern of a limb (paw) from one contact with the ground to the next contact of the same limb.
- A stride cycle duration = stance duration + swing duration
- X-axis represents the normalized stride interval
- Each bar represents the portion of time a paw in stance
- Data are from Paw Contact in the right-side panel
- The parameter Pixels/Stride shows the drawing width per stride. For example, 30 pixels/stride draws a stride interval with 30 pixels. The parameter can be adjusted to make stride interval drawing larger or smaller
- The chart can be exported to a high-resolution image
3. Gait Coordination
The Gait Coordination feature is key for understanding the essential interplay between the four limbs, quantified by the Phase Difference Chart. This analysis calculates the phase difference in degrees (normalized to 0 to 360 degree) for each pair of paws, revealing the relative timing and thus the degree of synchronization or coordination between them within the stride cycle. The core algorithm identifies the first stance phase of Paw B that occurs within the complete stride interval of Paw A. If a stance is found, the phase difference is calculated, showing the relative point in Paw A’s stride cycle when Paw B initiates its ground contact. This detailed, pairwise metric is vital because neurological and motor deficits often manifest as a breakdown in interlimb timing (e.g., left-right asymmetry or fore-hind paw mistiming), which are hallmark signs in many disease models.
| Parameter | Description | |
|---|---|---|
|
PawPair |
The paw pair locomotion pattern in frame |
|
|
PhaseDiffDeg |
Phase difference in degrees as the relative timing between two limbs (often left vs. right or fore vs. hind). It tells you how synchronized two paws are within the stride cycle |
|
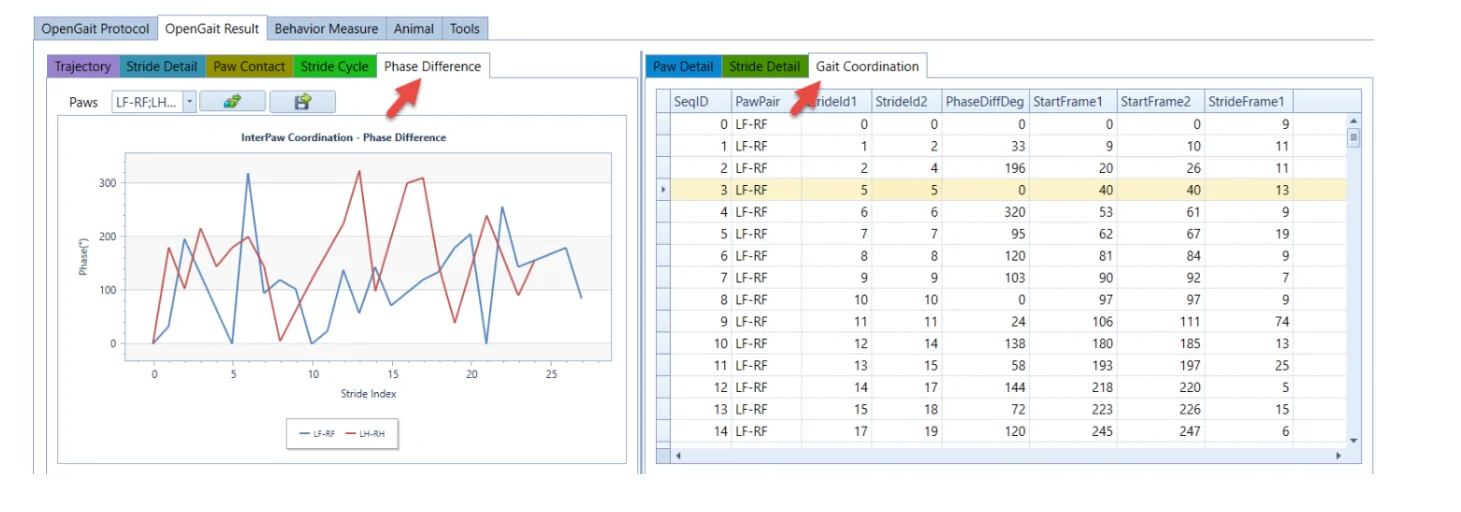
The Phase Difference Chart displays the relative timing between two limbs (often left vs. right or fore vs. hind). It tells you how synchronized two paws are within the stride cycle.
- The data are from the Gait Coordination tab on the right-side panel
- The chart can be exported to a high-resolution image
Gait-Related Conditions and Changes
| Condition | Expected Gait Changes | Gait Pattern Name | Cause |
|---|---|---|---|
|
Stroke (MCAO) |
Asymmetry, shorter stance/stride on one side |
Hemiparetic gait |
Cortical or motor tract damage |
|
Sciatic Nerve Injury |
Premature lifting, shorter stride, dragging |
Antalgic gait |
Unilateral nerve damage |
|
Spinal Cord Injury |
Hindlimb misalignment, delayed swing, paw slipping |
Paraparetic gait |
Disrupted coordination due to spinal lesions |
|
Traumatic Brain Injury |
Variable stride, favoring one side |
Post-TBI unsteady gait |
Subtle central motor impairment |
|
Cerebellar Ataxia |
Erratic stride, widened stance, irregular timing |
Ataxic gait |
Loss of cerebellar coordination |
|
Parkinson’s Disease Models |
Short, shuffling steps, increased stance, reduced stride |
Parkinsonian gait |
Dopaminergic neuron loss |
|
Joint Inflammation |
Shortened stance, prolonged swing, reduced contact |
Pain-induced gait |
Arthritis or inflammatory pain |
|
Tumor/Bone Pain |
Limp-like stepping, uneven stride |
Guarded gait |
Deep tissue discomfort |
|
Muscular Dystrophy |
Weak propulsion, dragging, toe drop |
Toe-dragging gait |
Progressive muscle weakening |
|
ALS Models (e.g., SOD1-G93A) |
Delayed contact, paw slipping, increased angle |
Motor neuron disease gait |
Neuronal degeneration |
|
Sedatives or Anesthetics |
Slowed, shortened stride, potential immobility |
Drug-induced hypolocomotion |
CNS suppression |
|
Neurostimulants |
Long or erratic strides |
Hyperkinetic gait |
CNS overstimulation |
|
Alzheimer’s or Motor Knockouts |
Reduced stride, cautious limb advancement |
Neurodegenerative gait |
Plaques or motor neuron damage |
|
Aging |
Slower steps, shorter stride, widened stance |
Senile gait |
Loss of strength and coordination |
|
Stress/Anxiety |
Shortened, erratic stride |
Cautious gait |
Defensive posture under stress |
|
Obesity/Metabolic Syndrome |
Slow walking, widened stance, prolonged ground contact |
Guarded gait |
Joint strain, altered center of mass |
References
- Hampton TG, Stasko MR, Kale A, Amende I, Costa AC. Gait dynamics in trisomic mice: quantitative neurological traits of Down syndrome. Physiol Behav. 2004 Sep 15;82(2-3):381-9. doi: 10.1016/j.physbeh.2004.04.006. PMID: 15276802.
- Fernagut, P. O., Diguet, E., Labattu, B., & Tison, F. (2002). A simple method to measure stride length as an index of nigrostriatal dysfunction in mice. Journal of Neuroscience Methods, 113(2), 123-130. https://doi.org/10.1016/S0165-0270(01)00485-X
- Hetze, S., Römer, C., Teufelhart, C., Meisel, A., & Engel, O. (2012). Gait analysis as a method for assessing neurological outcome in a mouse model of stroke. Journal of Neuroscience Methods, 206(1), 7–14. doi:10.1016/j.jneumeth.2012.02.00
- Pocratsky, A.M., Burke, D.A., Morehouse, J.R. et al. Reversible silencing of lumbar spinal interneurons unmasks a task-specific network for securing hindlimb alternation. Nat Commun 8, 1963 (2017). https://doi.org/10.1038/s41467-017-02033-x
- Ungvari, Z., Muranyi, M., Gulej, R., Negri, S., Nyul-Toth, A., Csik, B., Patai, R., Conley, S., Milan, M., Bagwell, J., Tarantini, A., Yabluchanskiy, A., Toth, P., Csiszar, A., Ungvari, A., Mukli, P., & Tarantini, S. (2024). Longitudinal detection of gait alterations associated with hypertension-induced cerebral microhemorrhages in mice: Predictive role of stride length and stride time asymmetry and increased gait entropy. GeroScience, 46(5), 4743. https://doi.org/10.1007/s11357-024-01210-3
- Fonio, E., & Feinerman, O. (2024). High mirror symmetry in mouse exploratory behavior. Frontiers in Behavioral Neuroscience, 18, 1381852. https://doi.org/10.3389/fnbeh.2024.1381852