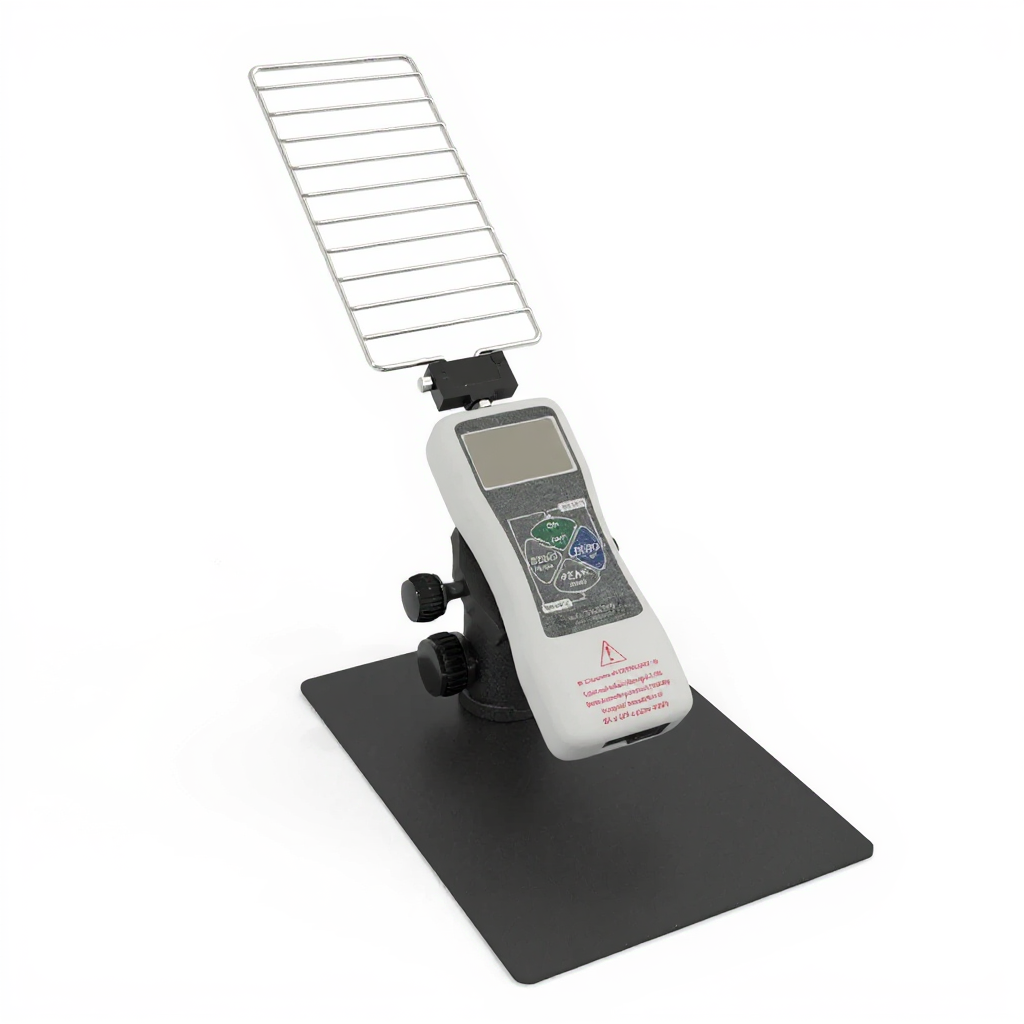
Behavioral Mazes

Grip Strength Test

$2,900.00

Precision grip strength measurement system for rodents featuring dual-sized stainless steel plates, 50 N force range, and 0.1g resolution with LED touchscreen display.

Key Specifications
gripping-plate-area
20×20 cm, 25x25cm
maximum-tensile-force
0 – 50 N (5kgf)
gripping_plate_area
20×20 cm, 25x25cm
maximum_tensile_force
0 – 50 N (5kgf)
frequency
50HZ
grip_plate_sizes
large and small
SKU:ME-5602
Need Help? Visit our Support CenterKnowledge base, order lookup, and ticket support
Scientist guidance
Louise Corscadden, PhD, Director of Science

Louise Corscadden, PhD

Director of Science · ConductScience

Ask Louise about Grip Strength Test fit, setup, configuration, or quote prep.

Accessories

Enhance your setup with compatible accessories

Total: $0.00

Frequently Bought Together

Total: $450.00

Use this apparatus with

The complete Grip Strength workflow

Track behavior

Capture peak force, pull duration, and accepted-versus-rejected trials so grip data are scored consistently across cohorts.

ConductVision Grip Strength ->

Run protocol

Forelimb and all-limb pull technique, pull angle and speed control, accepted-trial rules, and body-weight normalization.

ConductMaze Grip Strength Protocol ->

Analyze output

No exact grip-strength calculator page is currently published. Use the inline accepted-trial helper below and the sample-size planner; keep a dedicated grip analyzer as a roadmap gap.

Supporting page not yet built

Configuration considerations

Common Grip Strength setup decisions

Use these notes to scope species, cohort, tracking, and automation needs. Only verified product or support routes are linked from this section.

This productForelimb

Forelimb Grip Strength Meter

Single force gauge with a triangular pull bar and peak-hold readout

Standard configuration for forelimb neuromuscular strength, recording peak tension as the animal grips the bar and is drawn horizontally away from it.

Quote

Request Quote
BuyableFore + hind

Fore- and Hindlimb Meter

Dual grid and bar attachments for separate forelimb and combined-limb pulls

Adds a mesh grid so forelimb-only and all-limb strength can be measured and compared within the same session.

Quote

View options ->
SpecialtyDigital

Digital Peak-Hold Gauge

Electronic force sensor with automatic peak capture and data logging

Best when many animals or repeated time points require automatic peak-force capture and exportable records rather than manual gauge reading.

Quote

Request automation help

§ 1

Introduction

The Grip Strength meter measures neuromuscular function by recording the peak force a rodent applies to a bar or grid before its grip releases. Meyer and colleagues described the routine fore- and hindlimb assessment that remains the basis of modern grip testing in toxicology, muscular dystrophy, aging, and cachexia models. 1

A trial works by letting the animal grasp the bar and then drawing it horizontally and steadily away until the grip breaks; the gauge holds the peak tension. Because the measurement is a maximum voluntary force, it is sensitive to motivation, pull technique, and body size as much as to true strength. 1

Pull speed, pull angle, the number of trials averaged, and body-weight normalization all change the recorded peak force. A defensible protocol fixes the pull technique, pre-defines which pulls are accepted, averages a set number of valid trials, and reports both absolute and body-weight-normalized force. 1

§ 2

Methods

2.1 Procedure

Standardized horizontal-pull testing with accepted-trial rules, trial averaging, and body-weight normalization.

Pre-test setup

  1. 1.Handling and acclimationAcclimate animals to handling and tail support so the measured pull reflects strength rather than struggling or freezing during restraint.
  2. 2.Calibrate the gaugeZero and calibrate the force sensor with a known mass before each session and confirm the peak-hold function captures and retains the maximum.
  3. 3.Fix pull techniqueDefine grip placement, a horizontal pull axis, and a steady pull speed. Upward angles and jerky pulls inflate or deflate peak force.
  4. 4.Set acceptance rulesDecide in advance how many trials are run, how many are averaged, and which pulls are rejected (early release, single-paw grip, assisted pull).

Trial sequence

  1. 1.Present the bar or gridAllow the animal to grasp the bar (forelimb) or grid (all-limb) firmly with the assigned limbs before any pull begins.
  2. 2.Pull horizontallyDraw the animal steadily backward by the tail base along a horizontal axis until the grip releases, then read the peak tension.1
  3. 3.Classify the trialAccept the pull only if grip and pull met the pre-defined criteria; reject and repeat early releases or single-limb grips.
  4. 4.Average valid trialsRecord the mean of the pre-set number of accepted trials rather than a single maximum, which is noisier and easier to bias.
  5. 5.Normalize and resetRecord body weight, compute body-weight-normalized force, and clean the bar or grid between subjects to remove odor.

Critical methodological constraints

  • Body weight. Absolute force scales with body size, so groups differing in weight must be compared with body-weight-normalized force, not raw grams.2
  • Pull technique. Pull speed and angle strongly affect peak force. A single trained operator and a horizontal, steady pull reduce technique-driven variance.2
  • Trial averaging. A single maximum is noisy. Pre-specify the number of accepted trials and average them so the endpoint is stable.
  • Motivation and restraint. Struggling, freezing, or poor tail support change the measured maximum without reflecting muscle strength.

2.2 Measurement & Analysis

Core grip-strength endpoints for neuromuscular function and quality control.

Peak Grip Force

Primary strength endpoint

Maximum tension recorded before grip release, the standard neuromuscular strength readout.1

Body-Weight-Normalized Force

Size-corrected strength

Peak force divided by body weight, required when comparing groups that differ in mass.2

Forelimb vs All-Limb Force

Limb-specific function

Separate forelimb (bar) and combined-limb (grid) measures localize neuromuscular deficits.

Accepted-Trial Rate

Quality-control flag

Fraction of pulls meeting acceptance criteria; a low rate signals technique or motivation problems that invalidate the average.

Trial-Averaged Force

Stable endpoint

Mean of the pre-set number of accepted pulls, more reliable than any single maximum.

+ Additional metrics: body weight, coefficient of variation across trials, pull duration, operator ID, gauge calibration value, and per-session notes.

2.3 accepted-trial rate (analysis)

A compact quality-control fraction of pulls that met the acceptance criteria.

Inline calculator

Type the values your tracker recorded.

Accepted-trial rate

83.3%

Formula: accepted pulls / (accepted pulls + rejected pulls) x 100. A low accepted-trial rate means the averaged peak force is unreliable; review pull technique, restraint, and motivation before interpreting strength differences. 1

2.4 sample-size planning

Estimate the N per group needed to detect a literature-anchored strength effect at the endpoint you plan to report. Override the defaults with your own pilot numbers.

sample-size planning

Estimate the N per group needed to detect a literature-anchored strength effect at the endpoint you plan to report. Override the defaults with your own pilot numbers.

Aged vs young male mouse forelimb pull; representative magnitudes from Takeshita et al. (2017) modified forelimb grip test.4

Cohen's d

1.60

N per group at 80% power

7

Total N

14

With attrition cushion

16

At 70% / 90% power

5 / 9

Methods sentence

Need ANOVA, proportions, paired design, or a power curve? Open in the full Sample-Size Calculator →

Formula: n = 2 · ((zα/2 + zβ) / d)2, where d = |μ₁ − μ₂| / σ. Assumes equal allocation, normality, and homoskedasticity. The attrition cushion inflates total N by 1 / (1 − dropout); confirm with your IACUC.

§ 3

Results

Aggregate publication data, sample apparatus output, and recent findings from the live PubMed feed.

3.1 Publication trends

PubMed volume and co-occurring behavioral methods for rodent grip-strength studies.

Figure 1 · EPM publications by year (PubMed)

The paradigm has been dominant for 40 years and is still growing.

Live · Weekly

2000201020202025 YTD: 98 papers

Total in PubMed since 1985: 1,980+ papers. Updated 2026-06-11.

Figure 2 · Methods co-occurring with EPM (last 12 months)

Other paradigms most often run alongside EPM in the same paper.

Live

3.2 Sample apparatus output

Representative forelimb grip output averaged over five accepted pulls.

Table 1 · Per-animal EPM scoring output

Download sample CSV →
AnimalGroupBody weightPeak forceNormalizedAccepted rate
GS-001Control28.4 g1.42 N5.10 gf/g83.3%
GS-002Control29.1 g1.48 N5.18 gf/g100%
GS-003Control27.8 g1.39 N5.10 gf/g83.3%
GS-004Wasting24.6 g1.02 N4.23 gf/g71.4%
GS-005Wasting23.9 g0.97 N4.14 gf/g83.3%
GS-006Wasting25.1 g1.06 N4.31 gf/g71.4%

Synthetic example for illustration only. Report both absolute and body-weight-normalized force, and pair with the accepted-trial rate before interpreting strength differences.

3.3 Recent findings (live PubMed feed)

  • Jun 2026Source note

    Grip-strength methods continue to emphasize body-weight normalization and trial averaging.

    Static methods note aligned with Meyer et al. (1979), Maurissen et al. (2003), and Bonetto et al. (2015).

    Review grip-strength studies for a fixed horizontal pull technique, pre-specified accepted-trial rules, a set number of averaged pulls, and both absolute and body-weight-normalized force before interpreting group differences.

    Methods overviewReproducibility
  • Jun 2026Source note

    Grip strength as one assay in a motor battery: pair with rotarod, balance beam, and gait.

    Static methods note aligned with Takeshita et al. (2017) and Brooks & Dunnett (2009).

    A single peak force is a screening signal. Neuromuscular deficits are most defensible when confirmed with normalized force, forelimb-versus-all-limb comparison, and an independent functional measure in the same cohort.

    Motor batteryNeuromuscular

View all 1980matching papers on PubMed ->

§ 4

Discussion

Limitations of the paradigm, methodological caveats, and current directions.

4.1 Common confounds

Variables that shift Grip Strength results independent of anxiety state.

Body weight

Absolute force scales with body size. Without normalization, a strength difference can simply reflect a weight difference between groups.

Pull technique

Pull speed, angle, and tail support change peak force. A single trained operator and a fixed horizontal pull reduce this variance.

Motivation and restraint

Struggling, freezing, or reluctance to grip lowers measured force without a true neuromuscular deficit.

Trial count

A single maximum is noisy. Averaging a fixed number of accepted pulls gives a more reliable endpoint.

Gauge calibration

An uncalibrated or drifting sensor biases all readings. Calibrate against a known mass each session.

Confound checklist

Tick the confounds your protocol addresses, then export a methods-paragraph blurb you can paste into your manuscript.

Preview exported markdown
## Grip Strength — methods controls

Confounds controlled in this protocol:

- **Body weight.** Absolute force scales with body size. Without normalization, a strength difference can simply reflect a weight difference between groups.
- **Pull technique.** Pull speed, angle, and tail support change peak force. A single trained operator and a fixed horizontal pull reduce this variance.
- **Motivation and restraint.** Struggling, freezing, or reluctance to grip lowers measured force without a true neuromuscular deficit.
- **Trial count.** A single maximum is noisy. Averaging a fixed number of accepted pulls gives a more reliable endpoint.
- **Gauge calibration.** An uncalibrated or drifting sensor biases all readings. Calibrate against a known mass each session.

4.2 Construct validity caveats

Grip strength is strongest when pull technique, accepted-trial rules, trial averaging, and body-weight normalization are fixed before testing. A single peak force is a screening signal; confirm neuromuscular deficits with normalized force, forelimb-versus-all-limb comparison, and an independent functional measure. 1

4.3 Special considerations

Should I report absolute or normalized force?

Report both. Absolute peak force is the raw measurement, but body-weight-normalized force is what allows fair comparison when groups differ in mass, which is common in disease and aging models.

Forelimb only or all-limb?

Forelimb (bar) testing is the most common and reproducible. Adding an all-limb (grid) pull helps localize whether a deficit is general or limb-specific.

How many trials should I average?

Pre-specify the number, commonly three to five accepted pulls, and average them. Averaging reduces the trial-to-trial noise inherent in a maximum-effort measurement.

4.4 Current directions

Quarterly editorial review of emerging Grip Strength methodology. Q2 2026

Methods

Normalization standards

Reporting body-weight-normalized force alongside absolute force is increasingly expected so strength is not confounded with mass.

Emerging

Digital peak capture

Electronic peak-hold gauges with logging reduce reader bias and make accepted-trial tracking and time-course studies easier.

Methods

Operator standardization

Because technique drives variance, single-operator testing and documented pull protocols improve reproducibility across labs.

Emerging

Multi-assay motor batteries

Grip strength is paired with rotarod, balance beam, and gait analysis to separate strength from coordination and fine motor control.

§ 5

References

7 selected methods and validation references for Grip Strength.

  1. Meyer OA, Tilson HA, Byrd WC, Riley MT. A method for the routine assessment of fore- and hindlimb grip strength of rats and mice. Neurobehav Toxicol. 1979;1(3):233-236. PMID:575054
  2. Maurissen JP, Marable BR, Andrus AK, Stebbins KE. Factors affecting grip strength testing. Neurotoxicol Teratol. 2003;25(5):543-553. doi:10.1016/s0892-0362(03)00073-4
  3. Bonetto A, Andersson DC, Waning DL. Assessment of muscle mass and strength in mice. Bonekey Rep. 2015;4:732. doi:10.1038/bonekey.2015.101
  4. Takeshita H, Yamamoto K, Nozato S, et al. Modified forelimb grip strength test detects aging-associated physiological decline in skeletal muscle function in male mice. Sci Rep. 2017;7:42323. doi:10.1038/srep42323
  5. Deacon RM. Measuring the strength of mice. J Vis Exp. 2013;(76):2610. doi:10.3791/2610
  6. Aartsma-Rus A, van Putten M. Assessing functional performance in the mdx mouse model. J Vis Exp. 2014;(85):51303. doi:10.3791/51303
  7. Brooks SP, Dunnett SB. Tests to assess motor phenotype in mice: a user's guide. Nat Rev Neurosci. 2009;10(7):519-529. doi:10.1038/nrn2652
Grip Strength Test
Grip Strength Test
$2,900.00
Added to quoteView Quote